本章我们以springboot+micrometer+prometheus+grafana为例,展示一套springboot监控系统的搭建使用。
安装promotheus、prometheus gateway
这次实例我使用gateway是因为我的springboot在本地启动、promethus在远程机器,远程机器不方便访问我的电脑ip。
下载启动prometheus gateway
wget https://github.com/prometheus/pushgateway/releases/download/v1.4.2/pushgateway-1.4.2.linux-amd64.tar.gz
tar -zxvf pushgateway-1.4.2.linux-amd64.tar.gz
./pushgateway-1.4.2.linux-amd64/pushgateway
下载安装prometheus
wget https://github.com/prometheus/prometheus/releases/download/v2.32.0/prometheus-2.32.0.linux-amd64.tar.gz
tar -zxvf prometheus-2.32.0.linux-amd64.tar.gz
# 修改prometheus-2.32.0.linux-amd64/prometheus.yml中的static_configs.targets,增加上prometheus pushgateway的ip:port port默认是9091
# 启动prometheus
./prometheus-2.32.0.linux-amd64/prometheus
搭建springboot项目
pom.xml中增加springboot-actuator依赖
<dependency>
	<groupId>org.springframework.boot</groupId>
	<artifactId>spring-boot-starter-actuator</artifactId>
</dependency>
<dependency>
	<groupId>io.micrometer</groupId>
	<artifactId>micrometer-registry-prometheus</artifactId>
</dependency>
<dependency>
	<groupId>io.prometheus</groupId>
	<artifactId>simpleclient_pushgateway</artifactId>
</dependency>
在application.properties文件中增加micrometer的配置, dev1:9091替换成自己的gateway地址
management.metrics.export.prometheus.pushgateway.enabled=true
management.metrics.export.prometheus.pushgateway.base-url=http://dev1:9091
management.endpoints.web.exposure.include=prometheus,health,info,metric
然后启动springboot项目
打开grafana导入micrometer的dashboard
grafana的安装启动在前面一章中进行了介绍。
现在我们已经搭建了prometheus和grafana,启动了springboot项目,监控数据会定期发送到prometheus中,现在我们需要用grafana展示相关的数据。
grafana中有一些dashboard模板,其中就有micrometer的。
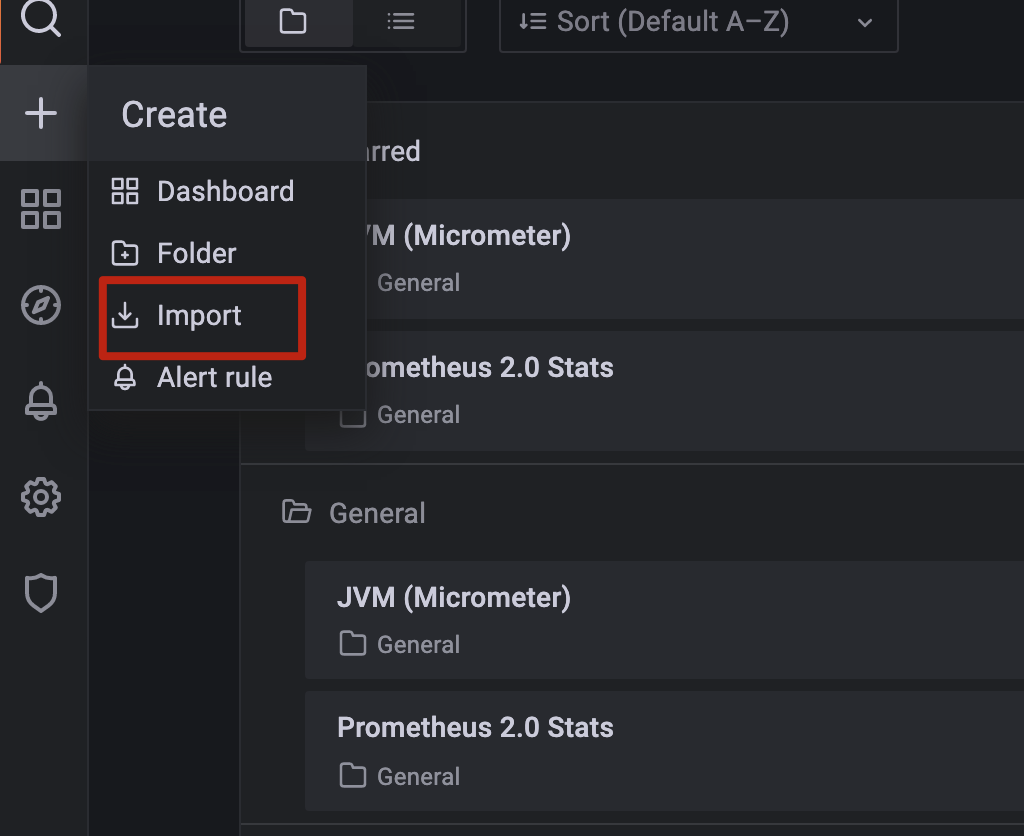
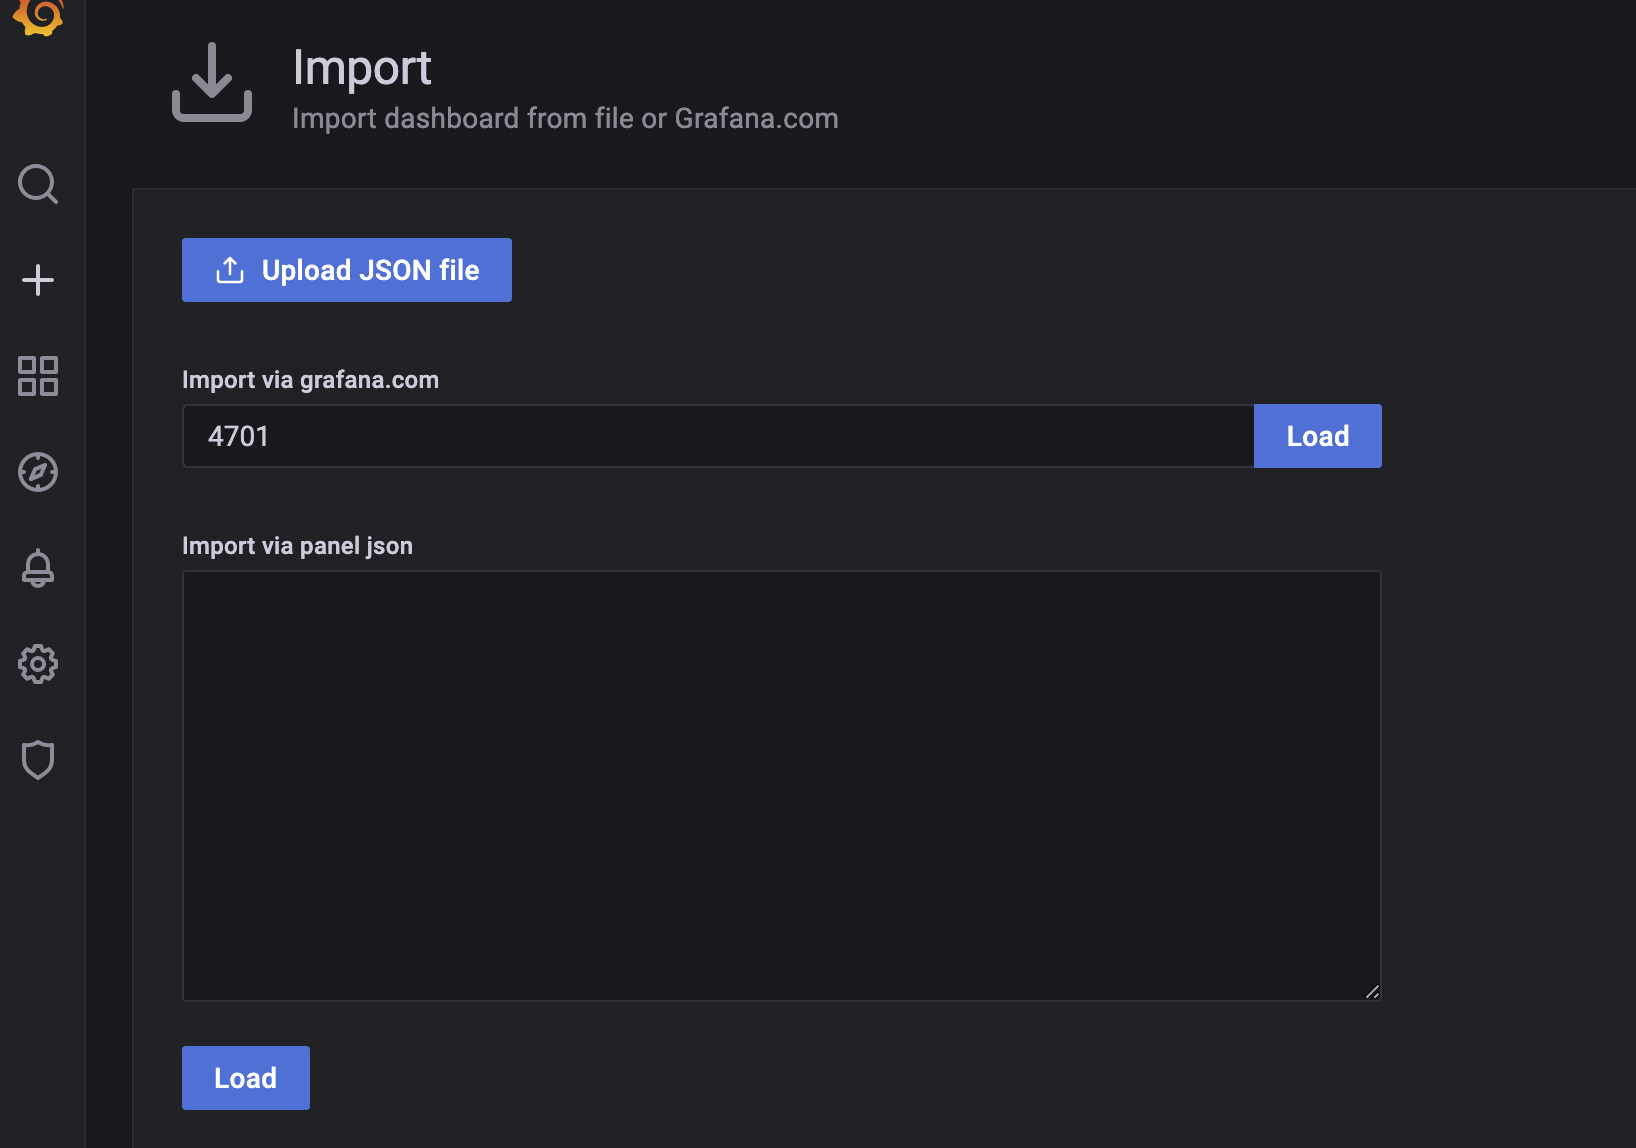
grafana左侧的➕ -> Import,Import via grafana中输入4701,点击Load, Import,就可以导入Dashboard了。
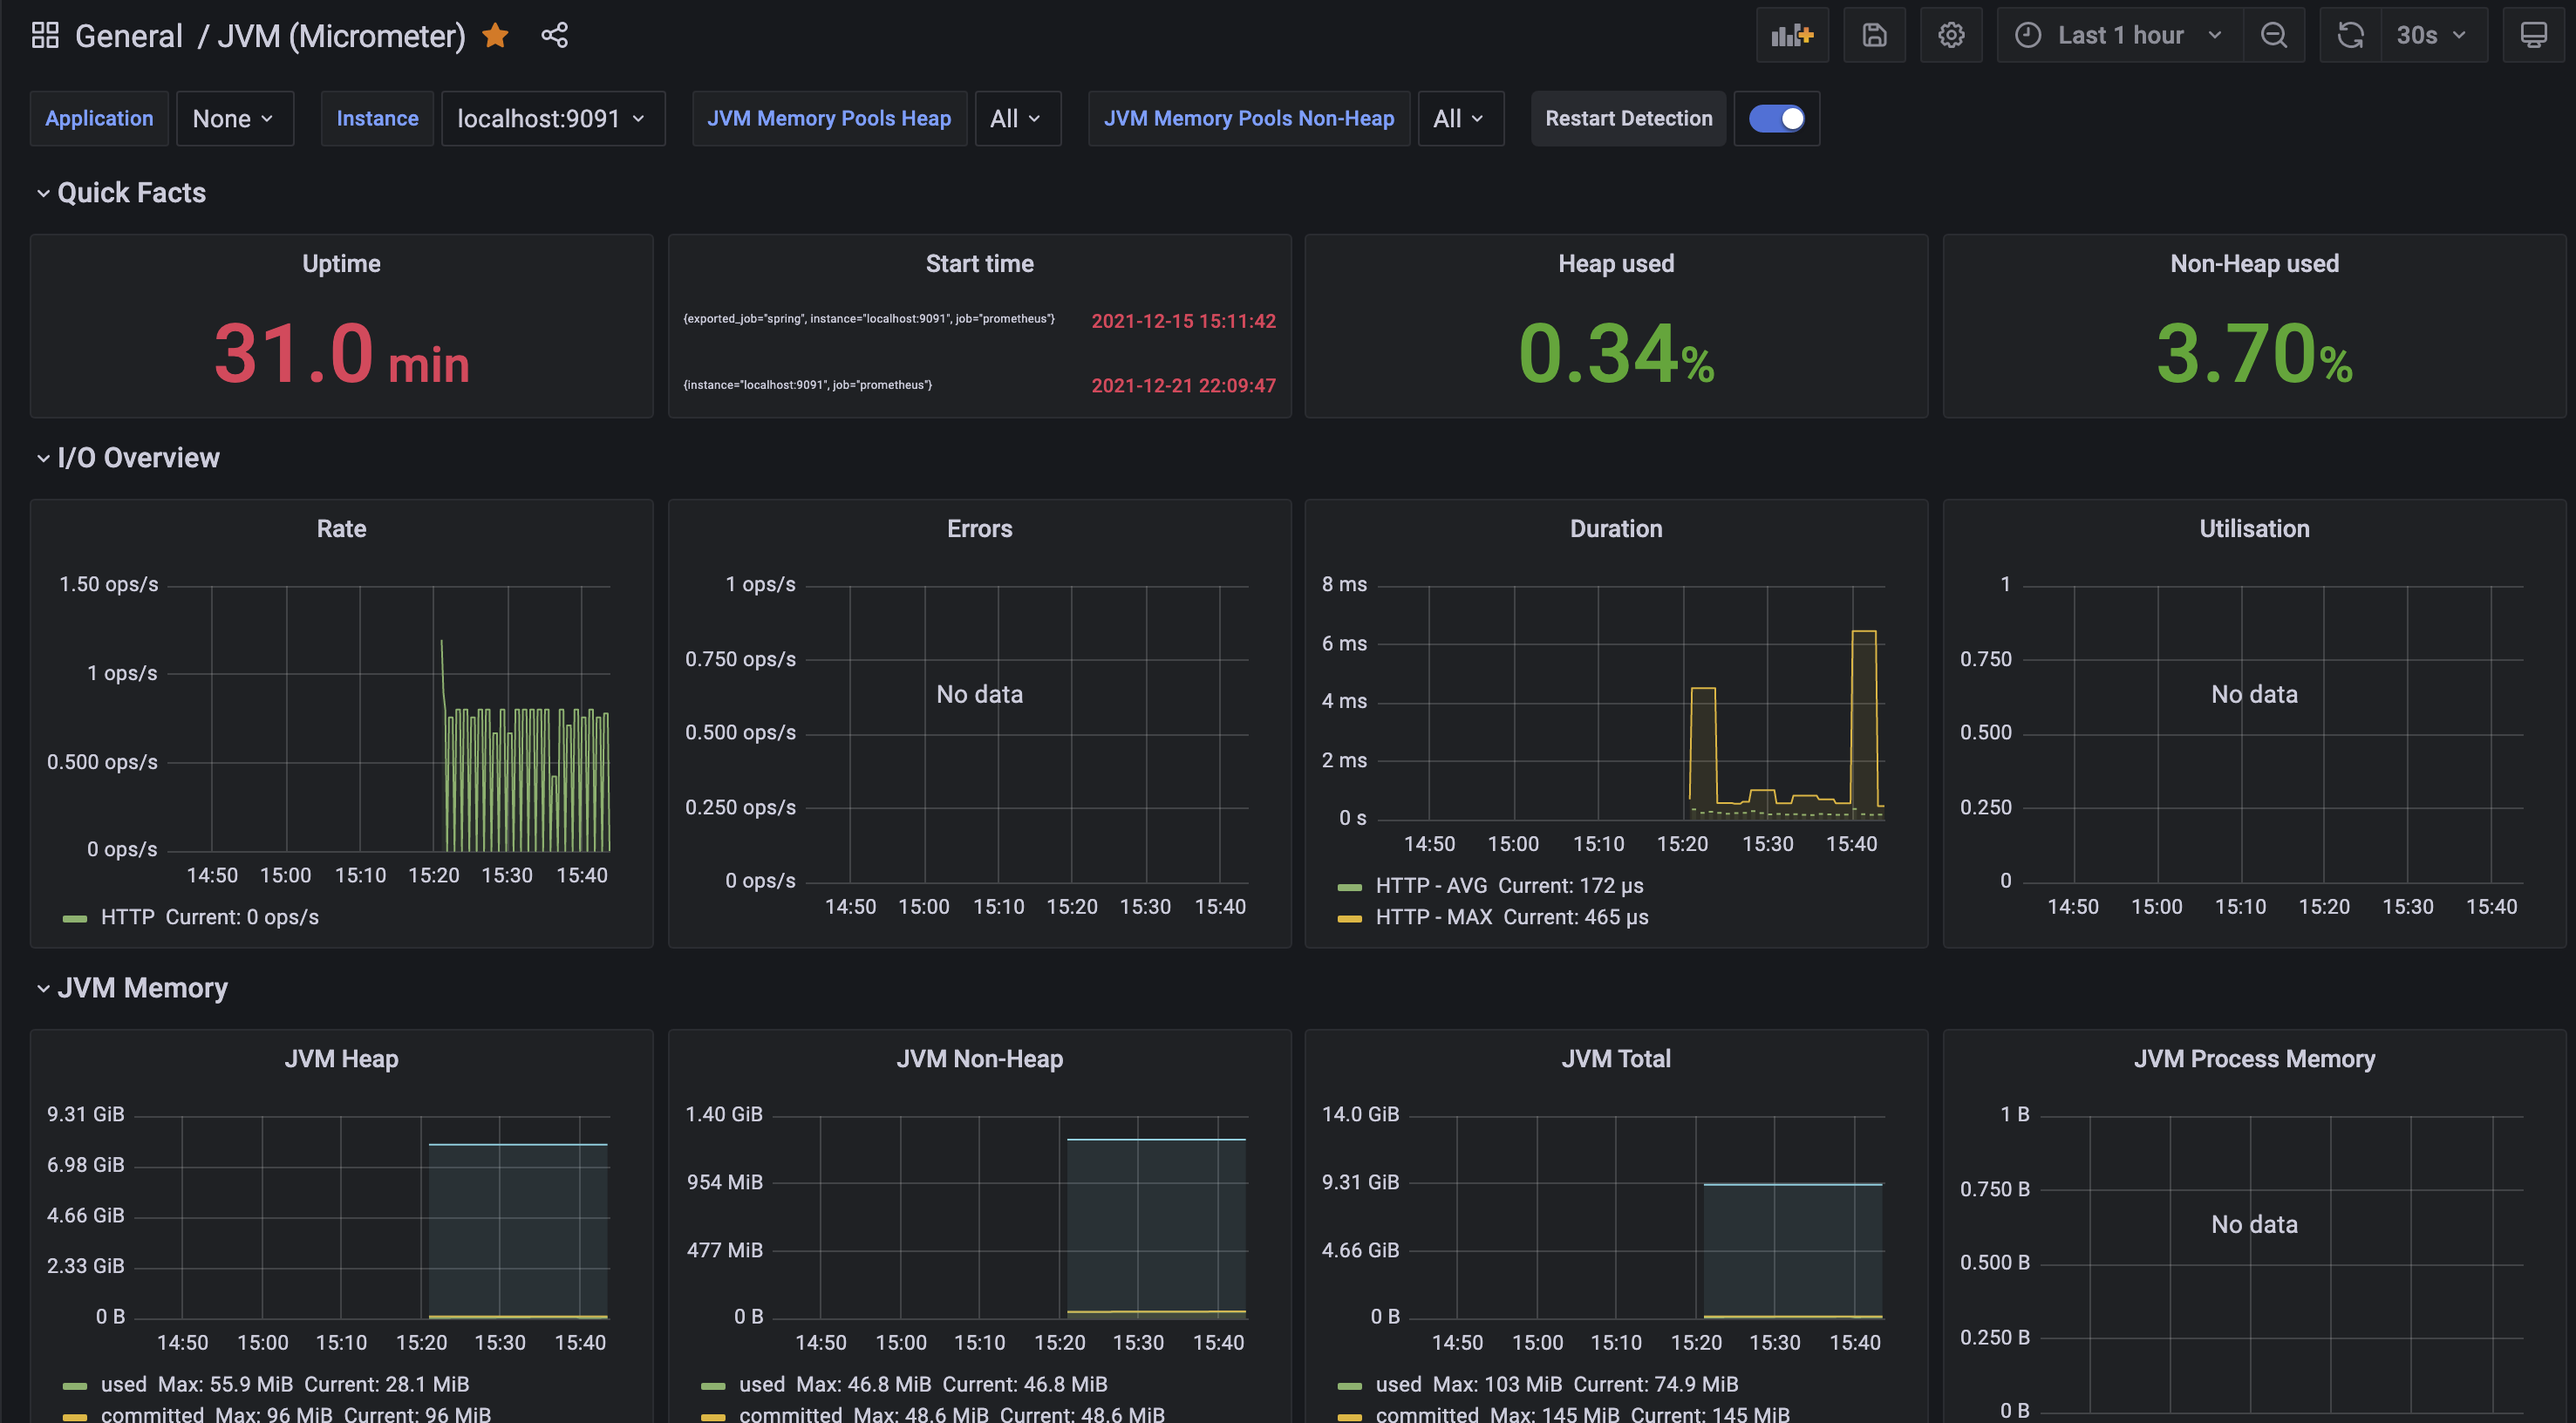
打开Micrometer的dashboard,就可以看到springboot micrometer自动上报的jvm监控数据,包括cpu、内存、io、线程等各类监控。
自定义业务数据监控
除了系统监控之外,我们一般还想看到业务的一些指标情况,这就需要我们在代码里进行数据的上报,然后自定义配置业务数据曲线。
下面我们实现几个incr接口,表示一个计数接口,在具体业务上可以表示用户充值金额、点赞量等等业务逻辑。
然后统计每分钟incr的总量和
micrometer中的统计类型
- Counter, 计数类型,例如统计incr的value值的总和,会对一段范围的值进行累加。或统计一分钟的请求量等。
- Gauge,测量值类型,例如表示当前内存的使用量、线程数等等,Gauge不会进行累加。
- Timer, 同时记录次数和耗时
- DistributionSummary和Timer类似,不过不限于表示时间的数据。
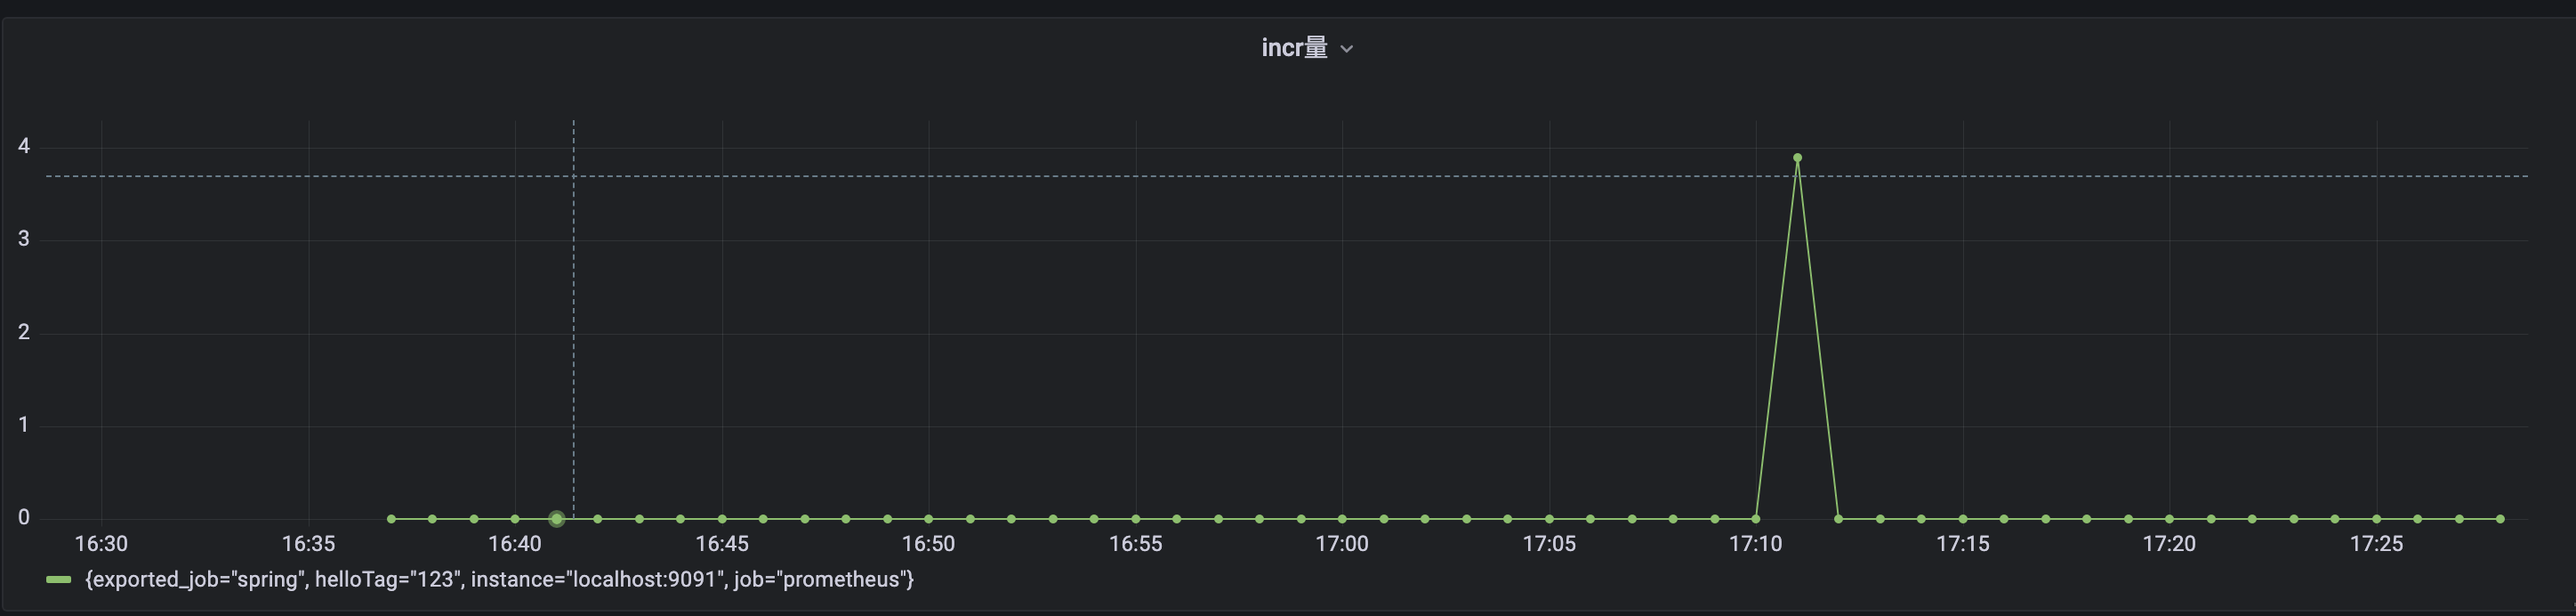
Counter类型实战
我们这里用counter统计查看每分钟的incr总和
@RestController
public class HelloController {

    @Autowired
    private MeterRegistry meterRegistry;

    @RequestMapping("/incr")
    public String hello(@RequestParam(value = "value", defaultValue = "1") int value) {
        meterRegistry.counter("incrValue", "helloTag", "123").increment(value);
        return "ok";
    }

}
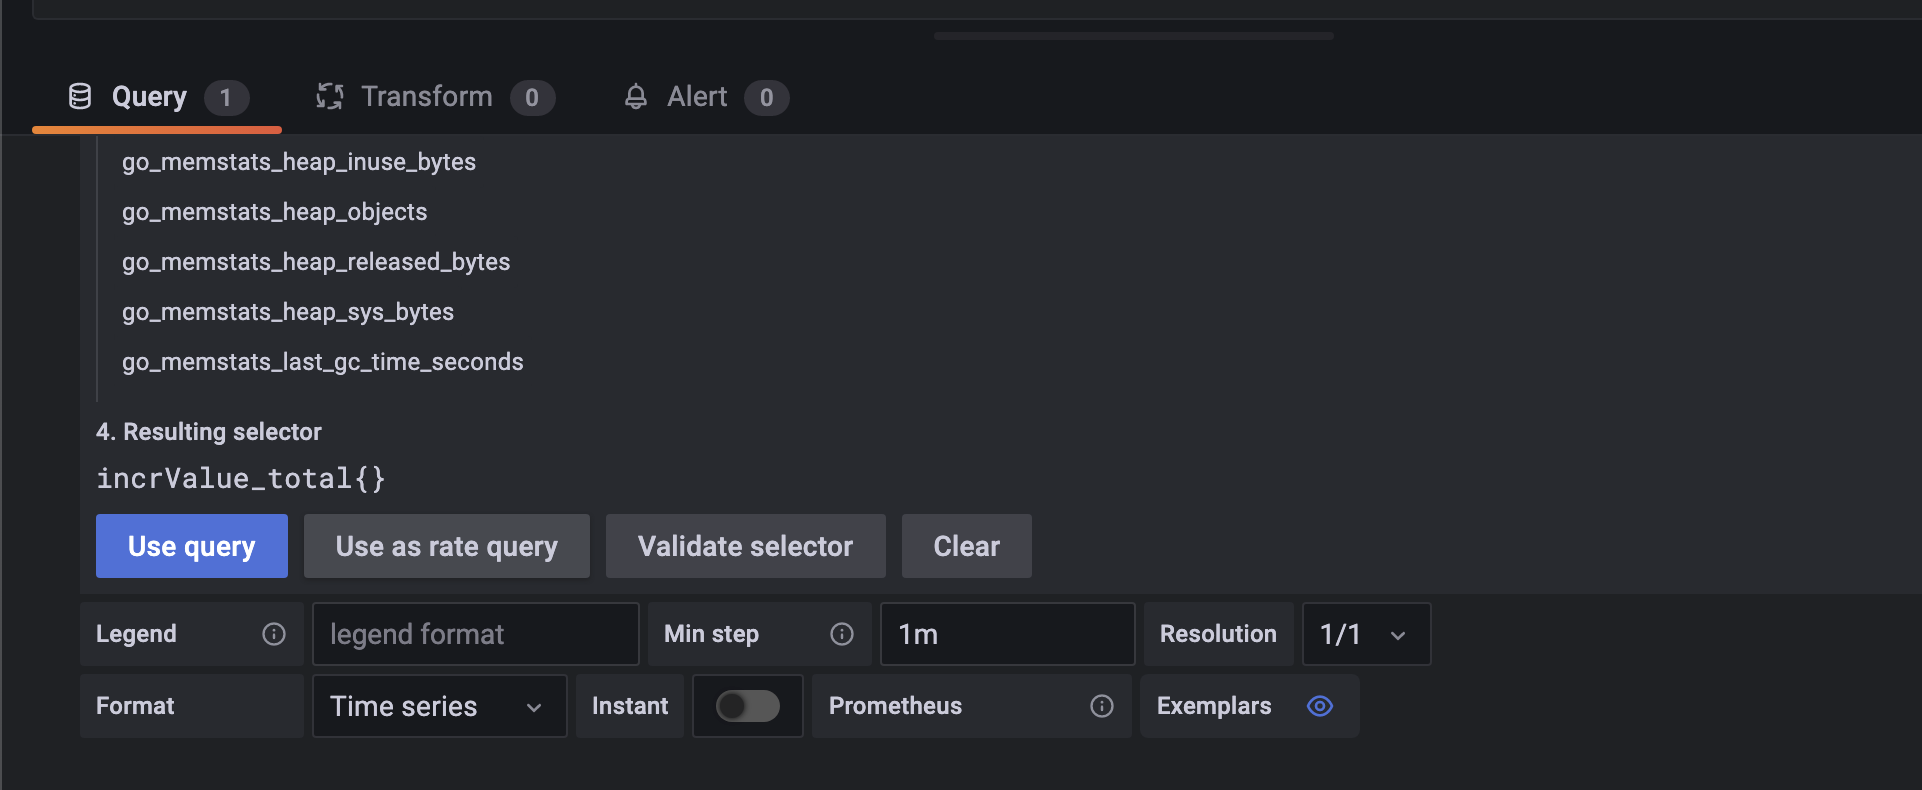
然后在grafana中新建一个Dashboard,新建一个Panel。在metrics browser中查找incrValue_total(对应我们代码中counter的值,加上了_total表示一段时间的总和),然后点击use as rate query(要不然展示的是全部时间的累加值),修改min step为1m(要不然在时间范围比较大的情况下会显示值为0)。
点击Save, Apply
请求几次/incr接口,稍微等一下(micrometer默认1分钟批量发送一次metrics数据),就可以在页面中查看到曲线数据了。
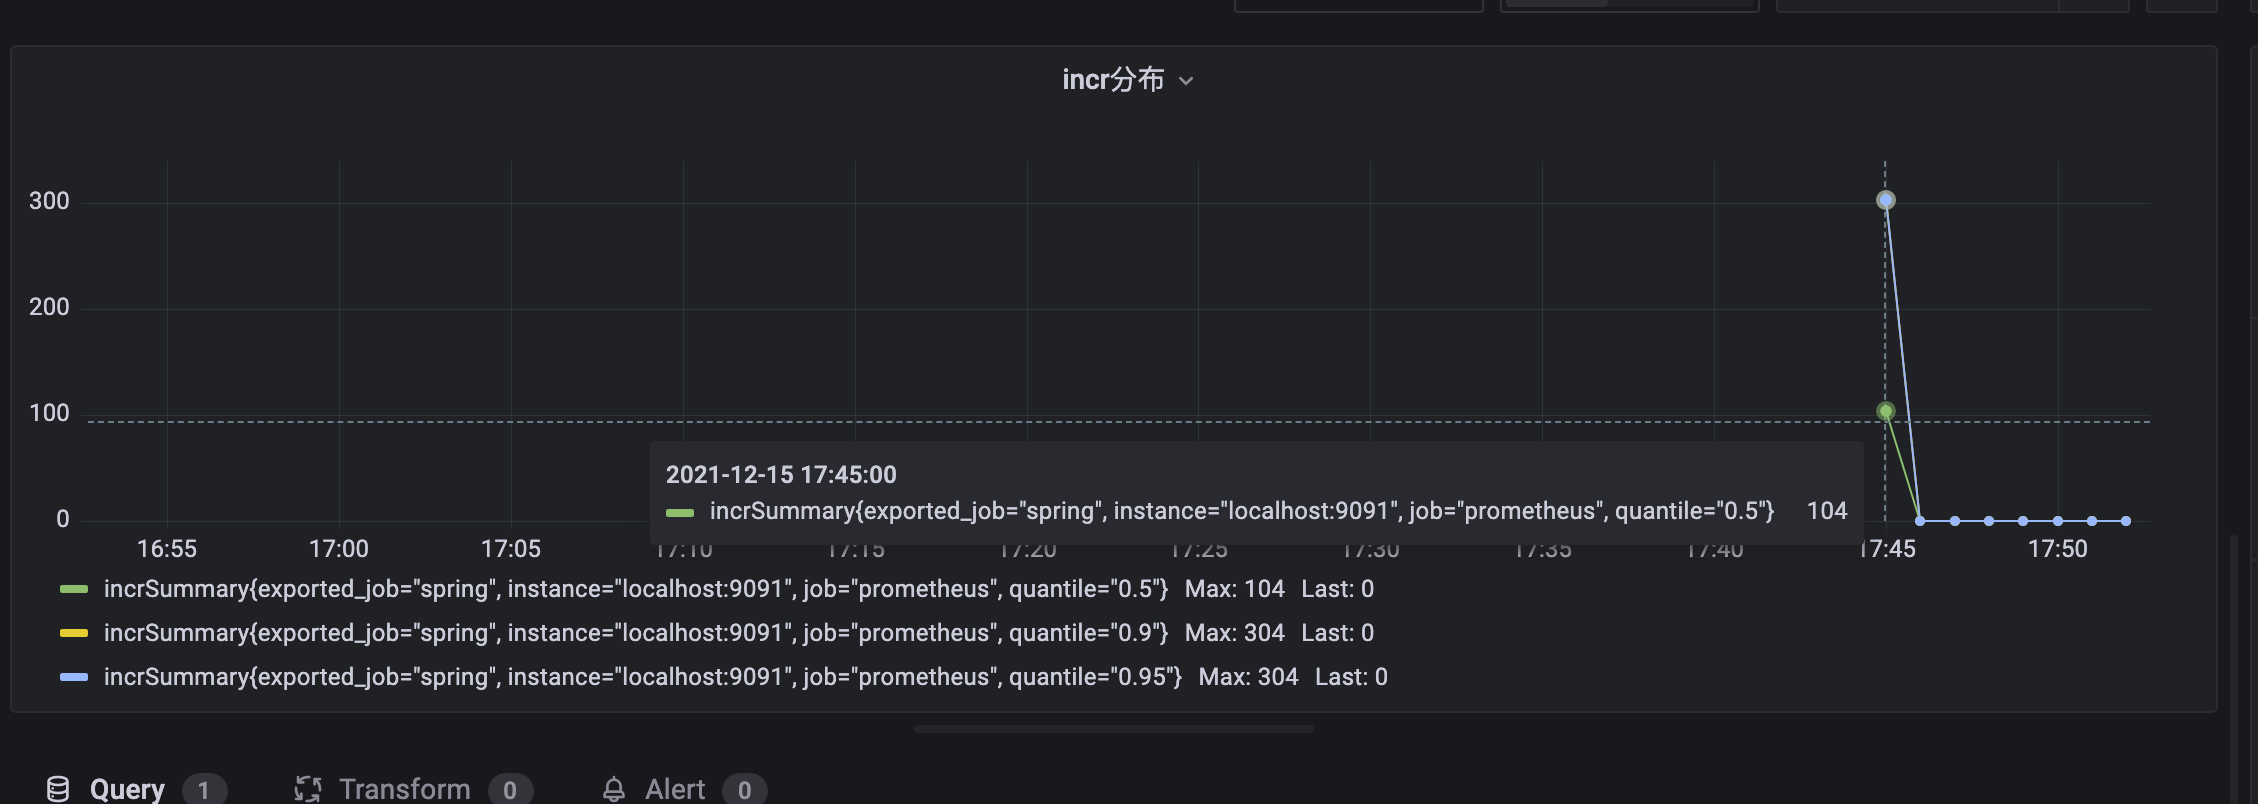
Histogram实战
下面我们统计下value值的百分位分布,比如p95是多少, p90是多少等等。
百分位功能需要通过MetricsFilter配置
@Configuration
public class MetricsConfig {

    @Autowired
    private MeterRegistry meterRegistry;

    @PostConstruct
    public void configMetrics() {
        meterRegistry.config()
                .meterFilter(new MeterFilter() {
                    @Override
                    public DistributionStatisticConfig configure(Meter.Id id, DistributionStatisticConfig config) {
                        return DistributionStatisticConfig.builder()
                                .percentiles(0.95, 0.9, 0.5)
                                .build()
                                .merge(config);
                    }
                });
    }
}
然后通过summary方法统计
meterRegistry.summary("incrSummary").record(value);
稍后在grafana中就能查询到incrSummary的数据,并且有上述配置的各个百分位的tag数据。
更多资料
共同学习,写下你的评论
评论加载中...
作者其他优质文章