
使用Keras框架(后端可选tensorflow或者theano),可以画出卷积神经网络的结构图帮助我们理解或确认自己创立的模型。
问题的关键在于使用
from keras.utils.visualize_util import plot中的plot函数。
但是直接使用会提示缺少pydot。
首先安装sudo pip3 install pydot以及sudo apt-get install graphviz(在Ubuntu上)。但是会提示一个和新版keras的兼容问题。于是我们需要安装
sudo pip3 install pydot-ng来解决这个问题。现在就可以画出结构图了:
使用样例一
from keras.layers import Input, Convolution2D, Flatten, Dense, Activationfrom keras.models import Sequentialfrom keras.optimizers import SGD , Adamfrom keras.initializations import normalfrom keras.utils.visualize_util import plot# apply a 3x3 convolution with 64 output filters on a 256x256 image:model = Sequential()
model.add(Convolution2D(64, 3, 3, border_mode='same', dim_ordering='th',input_shape=(3, 256, 256)))# now model.output_shape == (None, 64, 256, 256)# add a 3x3 convolution on top, with 32 output filters:model.add(Convolution2D(32, 3, 3, border_mode='same', dim_ordering='th'))# now model.output_shape == (None, 32, 256, 256)adam = Adam(lr=1e-6)
model.compile(loss='mse',optimizer=adam)
print("We finish building the model")

plot(model, to_file='model1.png', show_shapes=True)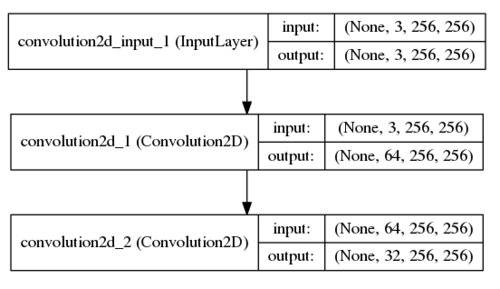
样例一
使用样例二
from keras.layers import Input, Convolution2D, MaxPooling2D, Flatten, Densefrom keras.models import Modelfrom keras.utils.visualize_util import plot

inputs = Input(shape=(229, 229, 3))

x = Convolution2D(32, 3, 3, subsample=(2, 2), border_mode='valid', dim_ordering='tf')(inputs)

x = Flatten()(x)
loss = Dense(32, activation='relu', name='loss')(x)
model = Model(input=inputs, output=loss)
model.compile(optimizer='rmsprop', loss='binary_crossentropy')# visualize model layout with pydot_ngplot(model, to_file='model2.png', show_shapes=True)
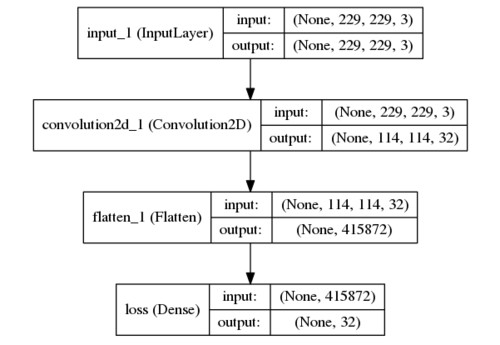
样例二
使用样例三
from keras.layers import Input, Convolution2D, Flatten, Dense, Activationfrom keras.models import Sequentialfrom keras.optimizers import SGD , Adamfrom keras.initializations import normalfrom keras.utils.visualize_util import plot

print("Now we build the model")
model = Sequential()
img_channels = 4 #output dimenson nothing with channelsimg_rows = 80img_cols = 80model.add(Convolution2D(32, 8, 8, subsample=(4,4),init=lambda shape, name: normal(shape, scale=0.01, name=name), border_mode='same', dim_ordering='th',input_shape=(img_channels,img_rows,img_cols)))
model.add(Activation('relu'))
model.add(Convolution2D(64, 4, 4, subsample=(2,2),init=lambda shape, name: normal(shape, scale=0.01, name=name), border_mode='same', dim_ordering='th'))
model.add(Activation('relu'))
model.add(Convolution2D(64, 3, 3, subsample=(1,1),init=lambda shape, name: normal(shape, scale=0.01, name=name), border_mode='same', dim_ordering='th'))
model.add(Activation('relu'))
model.add(Flatten())
model.add(Dense(512, init=lambda shape, name: normal(shape, scale=0.01, name=name)))
model.add(Activation('relu'))
model.add(Dense(2,init=lambda shape, name: normal(shape, scale=0.01, name=name)))

adam = Adam(lr=1e-6)
model.compile(loss='mse',optimizer=adam)
print("We finish building the model")

plot(model, to_file='model3.png', show_shapes=True)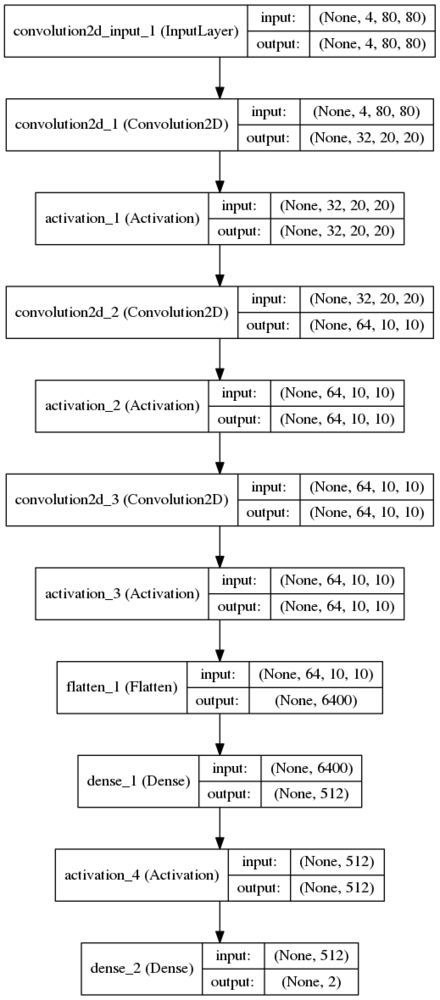
model3
作者:treelake
链接:https://www.jianshu.com/p/56a05b5e4f20
点击查看更多内容
为 TA 点赞
评论
共同学习,写下你的评论
评论加载中...
作者其他优质文章
正在加载中


感谢您的支持,我会继续努力的~
扫码打赏,你说多少就多少
赞赏金额会直接到老师账户
支付方式
打开微信扫一扫,即可进行扫码打赏哦