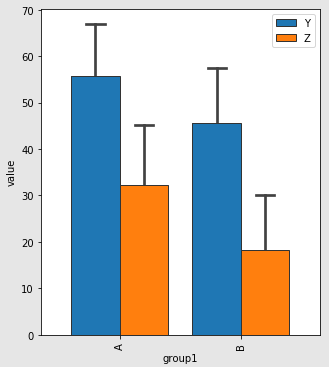
我正在使用 seaborn barplot 函数来绘制来自不同组的数据。是否可以仅在一个方向(仅向上但不能向下)绘制误差线?这就是我所拥有的:np.random.seed(2)df = pd.DataFrame({'value': np.random.randint(0,100,20), 'group1': ['A','B']*10, 'group2': ['Y','Z']*5 + ['Z','Y']*5 })fig, ax = plt.subplots(1,1,figsize=[5,6])sns.barplot('group1','value','group2',data=df, ax=ax,capsize=.15, lw=1, edgecolor=".2", ci=68) # SEM errorbarsplt.show()这就是我想要的:
1 回答
慕码人2483693
TA贡献1860条经验 获得超9个赞
我在 seaborn 中看不到默认选项,但我们可以用zorder
fig, ax = plt.subplots(1,1,figsize=[5,6])
# plot the error bars
# notice the zorder
sns.barplot('group1','value','group2',
data=df,
ax=ax,capsize=.15, zorder=5,
ci=68) # SEM errorbars
# plot the mean bars
# notice the zorder
sns.barplot('group1','value','group2',
data=df,
ax=ax, lw=1, edgecolor=".2",
zorder=10,
ci=None) # no CI errorbars
# handle the duplicate legend
handles, labels = ax.get_legend_handles_labels()
ax.legend(handles[-2:], labels[-2:], title='group2')
plt.show()
输出:
添加回答
举报
0/150
提交
取消