我是 matplotlib 的新手,并且正在处理周一到周五仅在9to间隔中具有值的数据。5当我尝试绘制数据时,我注意到在下一个工作日之间17:00和9:00下一个工作日之间的缺失值之间存在插值,这是由于 matplotlib 突然包含了缺失的日期时间。我的目标是:1)在不连续的左侧添加垂直虚线2)删除插值以下是我正在使用的代码片段。该代码将生成两个图。import numpy as npimport pandas as pdimport matplotlib.pyplot as pltfrom datetime import datetimex_var1= pd.date_range(datetime(2014, 1, 14, 9, 0),datetime(2014, 1, 21, 17, 0), freq="30min", tz= 'US/Pacific', closed= 'left' )x_var1 = x_var1[x_var1.dayofweek < 5]x_var1= x_var1[x_var1.indexer_between_time('9:00','17:00', include_end= False)]x_var1= x_var1[x_var1.hour != 12]np.random.seed(0)y_var2= np.random.normal(loc= 40, scale= 4.4, size= len(x_var1))fig, ax= plt.subplots(nrows= 2, ncols= 1)ax[0].plot(x_var1, y_var2)ax[0].set_title("This plot has extra interpolation that needs to be removed and needs vertical dotted lines for discontinuities")x_var2= np.arange(len(x_var1))ax[1].plot(x_var2, y_var2)ax[1].set_title("this plot only needs correct xaxis and added vertical dotted lines for discontinuities")plt.show()我的目标是使顶部图看起来像底部图,除了底部图需要将其 x 轴更改为顶部图的 x 轴并在不连续的左侧添加垂直虚线。我对 matplotlib 的世界还很陌生,所以我不确定如何以 Python 的方式高效地完成这些事情。编辑:将示例数据集更改为更随机的数据集,以更好地反映实际问题。12:00还包括午休时间,因此在和之间会丢失数据12:59
2 回答
波斯汪
TA贡献1811条经验 获得超4个赞
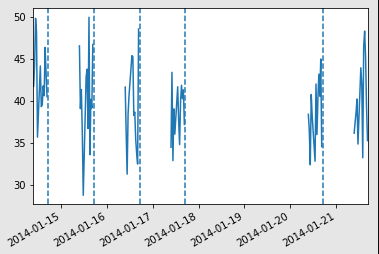
好的,这就是你要找的吗?
import numpy as np
import pandas as pd
import matplotlib.pyplot as plt
x_var1= pd.date_range(pd.to_datetime('2014-01-14 09:00:00'), pd.to_datetime('2014-01-21 17:00:00'),
freq="30min",
tz= 'US/Pacific',
closed= 'left'
)
x_var1 = x_var1[x_var1.dayofweek < 5]
x_var1= x_var1[x_var1.indexer_between_time('9:00','17:00', include_end= True)]
x_var1= x_var1[x_var1.hour != 12]
np.random.seed(0)
y_var2= np.random.normal(loc= 40, scale= 4.4, size= len(x_var1))
df = pd.DataFrame(index=x_var1, data=y_var2)
# mpl won't plot between nan values
df[(df.index.hour == 17) & (df.index.minute == 0)] = np.nan
df[(df.index.hour == 9) & (df.index.minute == 0)] = np.nan
fig, ax = plt.subplots()
df.plot(ax=ax, legend=False)
df[(df.index.hour == 9) & (df.index.minute == 0)] = 0
# we know the discontinuities occur at the end of the days
[plt.axvline(d, ls='--') for d, v in list(zip(df.index, df.iloc[:, 0])) if pd.isnull(v)]
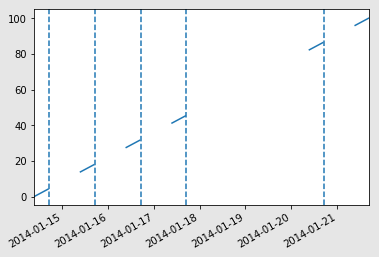
隔江千里
TA贡献1906条经验 获得超10个赞
这就是我将如何做到这一点。不确定我是否将垂直线放在正确的不连续处,但希望你能明白:
import numpy as np
import pandas as pd
import matplotlib.pyplot as plt
x_var1= pd.date_range(pd.to_datetime('2014-01-14 09:00:00'), pd.to_datetime('2014-01-21 17:00:00'),
freq="30min",
tz= 'US/Pacific',
closed= 'left'
)
x_var1 = x_var1[x_var1.dayofweek < 5]
x_var1= x_var1[x_var1.indexer_between_time('9:00','17:00', include_end= True)]
df = pd.DataFrame(index=x_var1, data=[np.nan]*len(x_var1))
df.iloc[0, 0] = 0
df.iloc[-1, 0] = 100
# to get line with "slope of 1"
df = df.interpolate(method='time')
# mpl won't plot between nan values
df[(df.index.hour == 17) & (df.index.minute == 0)] = np.nan
df[(df.index.hour == 9) & (df.index.minute == 0)] = np.nan
fig, ax = plt.subplots()
df.plot(ax=ax, legend=False)
df[(df.index.hour == 9) & (df.index.minute == 0)] = 0
# we know the discontinuities occur at the end of the days
[plt.axvline(d, ls='--') for d, v in list(zip(df.index, df.iloc[:, 0])) if pd.isnull(v)]
输出:
添加回答
举报
0/150
提交
取消