1 回答
TA贡献1744条经验 获得超4个赞
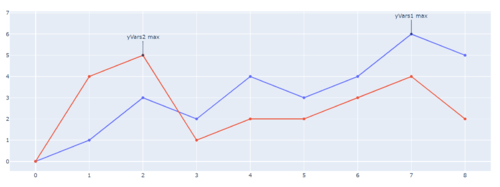
如果您只想突出显示某些特定值,请使用add_annotation(). 在您的情况下,只需找到您想要关注的 X 的最大和最小 Y。缺少您身边的数据样本,以下是我使用通用数据样本的方法:
阴谋:

代码:
import plotly.graph_objects as go
import plotly.io as pio
pio.renderers.default='browser'
fig = go.Figure()
xVars1=[0, 1, 2, 3, 4, 5, 6, 7, 8]
yVars1=[0, 1, 3, 2, 4, 3, 4, 6, 5]
xVars2=[0, 1, 2, 3, 4, 5, 6, 7, 8]
yVars2=[0, 4, 5, 1, 2, 2, 3, 4, 2]
fig.add_trace(go.Scatter(
x=xVars1,
y=yVars1
))
fig.add_trace(go.Scatter(
x=xVars2,
y=yVars2
))
fig.add_annotation(
x=yVars1.index(max(yVars1)),
y=max(yVars1),
text="yVars1 max")
fig.add_annotation(
x=yVars2.index(max(yVars2)),
y=max(yVars2),
text="yVars2 max")
fig.update_annotations(dict(
xref="x",
yref="y",
showarrow=True,
arrowhead=7,
ax=0,
ay=-40
))
fig.update_layout(showlegend=False)
fig.show()
添加回答
举报
