我正在使用的数据是对话消息日志。我有一个熊猫数据帧,以日期戳作为索引,还有两列;一个用于“发件人”,一个用于“消息”。我只是试图绘制一个随时间变化的消息堆栈图。我实际上并不需要消息的内容,因此我按如下方式清理了数据:dfgrouped = df.groupby(["sender"])dfgrouped[["sender"]].resample("D").count()这将提供按对话中的每个发件人分组的数据帧,其中 DateTime 作为索引,并在给定日期发送的消息数。dfgrouped[["sender"]].get_group("Joe Bloggs").resample("D").count()...将给出一个只有一个用户的数据帧,并且他们的消息每天计数。我想知道如何使用 matplotlib 来绘制一个堆栈图,其中每个“发送方”是一条不同的线。我也无法通过ax.stackplot(dfgrouped[["sender"]].resample("D").count())或通过循环:for sender in df["sender"].unique(): axs[i].stackplot(dfgrouped[["sender"]].get_group(sender).resample("D").count()
1 回答
神不在的星期二
TA贡献1963条经验 获得超6个赞
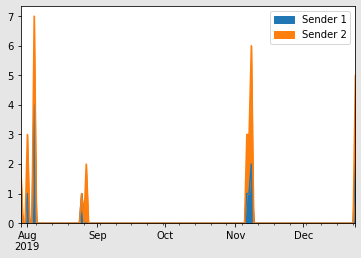
您可以使用熊猫自己的堆栈图函数,df.plot.area()。这是 Matplotlib 函数的包装器,用作数据帧上的方法。您只需要将数据保持在正确的形状。通过您的分组和计数操作,您几乎就在那里:
import pandas as pd
df = pd.DataFrame({'sender': [
'Person 2', 'Person 1', 'Person 2', 'Person 1', 'Person 2', 'Person 1', 'Person 2',
'Person 1', 'Person 1', 'Person 2', 'Person 1', 'Person 2', 'Person 1', 'Person 2',
'Person 2', 'Person 2', 'Person 2', 'Person 1', 'Person 2', 'Person 1', 'Person 2',
'Person 2', 'Person 1', 'Person 2', 'Person 2', 'Person 1', 'Person 2', 'Person 2',
'Person 1', 'Person 2', 'Person 1', 'Person 2'],
'message': [
'Hello', 'Hi there', "How's things", 'good', 'I am glad', 'Me too.',
'Then we are both glad', 'Indeed we are.',
'I sure hope this is enough fake conversation for stackoverflow.',
'Better write a few more messages just in case',
"But the message content isn't relevant", 'Oh yeah.', "I'm going to stop now.",
'redacted', 'redacted', 'redacted', 'redacted', 'redacted', 'redacted', 'redacted',
'redacted', 'redacted', 'redacted', 'redacted', 'redacted', 'redacted', 'redacted',
'redacted', 'redacted', 'redacted', 'redacted', 'redacted']},
index = pd.DatetimeIndex([
pd.Timestamp('2019-07-29 19:58:00'), pd.Timestamp('2019-07-29 20:03:00'),
pd.Timestamp('2019-08-01 19:22:00'), pd.Timestamp('2019-08-01 19:23:00'),
pd.Timestamp('2019-08-01 19:25:00'), pd.Timestamp('2019-08-04 11:28:00'),
pd.Timestamp('2019-08-04 11:29:00'), pd.Timestamp('2019-08-04 11:29:00'),
pd.Timestamp('2019-08-04 12:43:00'), pd.Timestamp('2019-08-04 12:49:00'),
pd.Timestamp('2019-08-04 12:51:00'), pd.Timestamp('2019-08-04 12:51:00'),
pd.Timestamp('2019-08-25 22:33:00'), pd.Timestamp('2019-08-27 11:55:00'),
pd.Timestamp('2019-08-27 18:35:00'), pd.Timestamp('2019-11-06 18:53:00'),
pd.Timestamp('2019-11-06 18:54:00'), pd.Timestamp('2019-11-06 20:42:00'),
pd.Timestamp('2019-11-07 00:16:00'), pd.Timestamp('2019-11-07 15:24:00'),
pd.Timestamp('2019-11-07 16:06:00'), pd.Timestamp('2019-11-08 11:48:00'),
pd.Timestamp('2019-11-08 11:53:00'), pd.Timestamp('2019-11-08 11:55:00'),
pd.Timestamp('2019-11-08 11:55:00'), pd.Timestamp('2019-11-08 11:59:00'),
pd.Timestamp('2019-11-08 12:03:00'), pd.Timestamp('2019-12-24 13:40:00'),
pd.Timestamp('2019-12-24 13:42:00'), pd.Timestamp('2019-12-24 13:43:00'),
pd.Timestamp('2019-12-24 13:44:00'), pd.Timestamp('2019-12-24 13:44:00')]))
df_group = df.groupby(["sender"])
df_count = df_group[["sender"]].resample("D").count()
df_plot = pd.concat([df_count.loc['Person 1', :],
df_count.loc['Person 2', :]],
axis=1)
df_plot.columns = ['Sender 1', 'Sender 2']
df_plot.plot.area()
添加回答
举报
0/150
提交
取消