我在Java有点新。现在,我正在尝试使用JFreeChart绘制XYPlot,其中域轴(X轴)和范围轴(Y轴)包含相同的范围。但不幸的是,滴答单位是不同的!出于这个原因,我尝试使用NumberAxis根据范围轴上的范围和刻度单位在域轴上设置范围和刻度单位。但差异仍然存在。我仍然无法找出为什么会发生这种情况。我正在附加此绘图的代码。此外,我正在附加问题的屏幕截图以及我真正想要的!请指导我在这里做错了什么... XYSeriesCollection lineChartDataAD = new XYSeriesCollection(); XYSeries seriesAD = new XYSeries("Real Surface Heights", false, true); for (int m = 0; m < pt.delayedy.length - 1; m++) { seriesAD.add((double)pt.delayedy[m], (double)pt.delayedy[m+1]); } lineChartDataAD.addSeries(seriesAD); if (jRadioButton10.isSelected()) { //as it is checkbox2.getState() == true pt.xaxisAD = pt.yvar+" ("+pt.xvar+") ["+pt.yunit+"]"; pt.yaxisADsupport = String.format("%f", (pt.xspace*pt.delay)); //pt.yaxisAD = pt.yvar +" (i+"+pt.yaxisADsupport+")"; pt.yaxisAD = pt.yvar+" ("+pt.xvar+"+d) ["+pt.yunit+"]"; jLabel44.setText("(Delay (d) = "+pt.yaxisADsupport+" "+pt.xunit+")"); } else if (jRadioButton11.isSelected()) { //as time series checkbox1.getState() == true //pt.yaxisAD = pt.yvar +" (i+"+pt.delay+")"; pt.xaxisAD = pt.yvar+" (i) ["+pt.yunit+"]"; pt.yaxisAD = pt.yvar +" (i+d) ["+pt.yunit+"]"; jLabel44.setText("(Delay (d) = "+pt.delay+")"); } JFreeChart lineChartAD = ChartFactory.createXYLineChart("", pt.xaxisAD, pt.yaxisAD, (XYDataset) lineChartDataAD, PlotOrientation.VERTICAL, false, false, false); XYPlot plotAD = lineChartAD.getXYPlot(); NumberAxis D = (NumberAxis) plotAD.getDomainAxis(); NumberAxis R = (NumberAxis) plotAD.getRangeAxis(); D.setRange(R.getRange()); D.setTickUnit(R.getTickUnit()); XYLineAndShapeRenderer rendererAD = new XYLineAndShapeRenderer();问题||的屏幕截图刻度单位不同所需结果||的屏幕截图两个轴上的刻度单位相同
1 回答
有只小跳蛙
TA贡献1824条经验 获得超8个赞
最后,我有一个解决这个问题的解决方法!而我还不知道这个问题的确切解决方案。
而不是尝试以下代码行,
NumberAxis D = (NumberAxis) plotAD.getDomainAxis();
NumberAxis R = (NumberAxis) plotAD.getRangeAxis();
D.setRange(R.getRange());
D.setTickUnit(R.getTickUnit());
我尝试了以下代码行:
//getting the number axes from the plot
NumberAxis D = (NumberAxis) plotAD.getDomainAxis();
NumberAxis R = (NumberAxis) plotAD.getRangeAxis();
//creating custom tick units based on lower and upper bound
Double DT = (D.getUpperBound() - D.getLowerBound())/5;
DecimalFormat DF = new DecimalFormat("#.#");
DF.setRoundingMode(RoundingMode.FLOOR);
String DTS = DF.format(DT);
DT = Double.parseDouble(DTS);
D.setTickUnit(new NumberTickUnit(DT));
Double RT = (R.getUpperBound() - R.getLowerBound())/5;
String RTS = DF.format(RT);
RT = Double.parseDouble(RTS);
R.setTickUnit(new NumberTickUnit(RT));
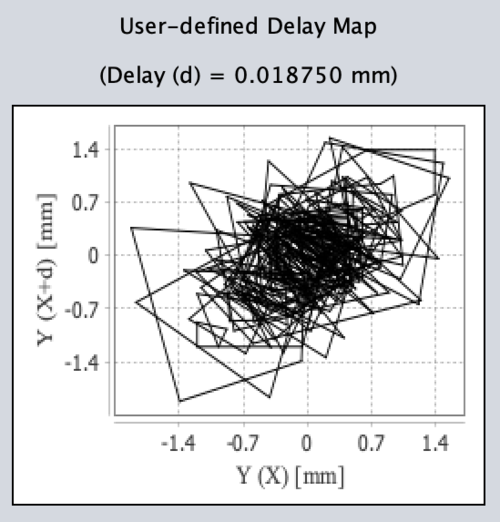
它的工作原理!!!请参阅下面附带的屏幕截图,这就是我想要的,两个轴上的相同刻度单位...
下面还给出了这种绘图的完整代码(可能会增加一些代码行,但我很高兴它适用于任何情况,直到我得到这个问题的确切解决方案):
//Creating XYseries based on an array (i.e., pt.delayedy)
XYSeriesCollection lineChartDataAD = new XYSeriesCollection();
XYSeries seriesAD = new XYSeries("Real Surface Heights", false, true);
for (int m = 0; m < pt.delayedy.length - 1; m++) {
seriesAD.add((double)pt.delayedy[m], (double)pt.delayedy[m+1]);
}
lineChartDataAD.addSeries(seriesAD);
//Customizing my axis labels (required for my purpose)
if (jRadioButton10.isSelected()) {
pt.xaxisAD = pt.yvar+" ("+pt.xvar+") ["+pt.yunit+"]";
pt.yaxisADsupport = String.format("%f", (pt.xspace*pt.delay));
pt.yaxisAD = pt.yvar+" ("+pt.xvar+"+d) ["+pt.yunit+"]";
}
else if (jRadioButton11.isSelected()) {
pt.xaxisAD = pt.yvar+" (i) ["+pt.yunit+"]";
pt.yaxisAD = pt.yvar +" (i+d) ["+pt.yunit+"]";
jLabel44.setText("(Delay (d) = "+pt.delay+")");
}
//Creating a JFreechart with my labels and series
JFreeChart lineChartAD = ChartFactory.createXYLineChart("", pt.xaxisAD, pt.yaxisAD, (XYDataset) lineChartDataAD, PlotOrientation.VERTICAL, false, false, false);
//Getting the chart plot
XYPlot plotAD = lineChartAD.getXYPlot();
//Creating the renderer for the chart
XYLineAndShapeRenderer rendererAD = new XYLineAndShapeRenderer();
rendererAD.setSeriesPaint(0, Color.BLACK);
double sizeAD = 0;
double deltaAD = sizeAD / 2.0;
Shape shapeAD = new Rectangle2D.Double(-deltaAD, -deltaAD, sizeAD, sizeAD);
rendererAD.setSeriesShape(0, shapeAD);
rendererAD.setSeriesStroke(0, new BasicStroke(1.0f));
//Customizing the font of the axes labels
Font F1AD = new Font ("Times New Roman", Font.PLAIN, 14);
plotAD.getDomainAxis().setLabelFont(F1AD);
plotAD.getRangeAxis().setLabelFont(F1AD);
//The below lines are for exact same x-scaling and y-scaling in plot
NumberAxis D = (NumberAxis) plotAD.getDomainAxis();
NumberAxis R = (NumberAxis) plotAD.getRangeAxis();
D.setAutoRangeIncludesZero(false);
R.setAutoRangeIncludesZero(false);
Double DT = (D.getUpperBound() - D.getLowerBound())/5;
DecimalFormat DF = new DecimalFormat("#.#");
DF.setRoundingMode(RoundingMode.FLOOR);
String DTS = DF.format(DT);
DT = Double.parseDouble(DTS);
D.setTickUnit(new NumberTickUnit(DT));
Double RT = (R.getUpperBound() - R.getLowerBound())/5;
String RTS = DF.format(RT);
RT = Double.parseDouble(RTS);
R.setTickUnit(new NumberTickUnit(RT));
//Plot customization
plotAD.setOutlinePaint(Color.BLACK);
plotAD.setOutlineStroke(new BasicStroke(0.5f));
plotAD.setRenderer(rendererAD);
plotAD.setBackgroundPaint(Color.WHITE);
plotAD.setRangeGridlinesVisible(true);
plotAD.setRangeGridlinePaint(Color.GRAY);
plotAD.setDomainGridlinesVisible(true);
plotAD.setDomainGridlinePaint(Color.GRAY);
//Creating ChartPanel
ChartPanel linePanelAD = new ChartPanel(lineChartAD, true, true, false, false, true);
linePanelAD.setMouseZoomable(false);
//Adding the ChartPanel to the JPanel
panelChartRMA4D.removeAll();
panelChartRMA4D.add(linePanelAD, BorderLayout.CENTER);
panelChartRMA4D.setVisible(true);
panelChartRMA4D.setBorder(new LineBorder (Color.BLACK));
panelChartRMA4D.validate();
添加回答
举报
0/150
提交
取消