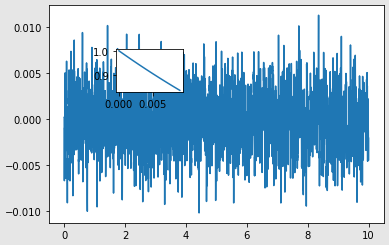
我正在尝试在主图中绘制一个缩放图。我成功地运行了代码并获得了绘图。但是没有放大。我的代码:# create some data to use for the plotdt = 0.001t = np.arange(0.0, 10.0, dt)r = np.exp(-t[:10]/0.05) # impulse responsex = np.random.randn(len(t))s = np.convolve(x, r)[:len(x)]*dt # colored noise# the main axes is subplot(111) by defaultplt.plot(t, s)# this is another inset axes over the main axesa = plt.axes([0.2, 0.6, .2, .2])plt.plot(t[:len(r)], r)plt.xlim(0, 0.2)plt.xticks([])plt.yticks([])plt.show()目前的输出:
1 回答
MYYA
TA贡献1868条经验 获得超4个赞
所以这段代码:
dt = 0.001
t = np.arange(0.0, 10.0, dt)
r = np.exp(-t[:10]/0.05)
x = np.random.randn(len(t))
s = np.convolve(x, r)[:len(x)] * dt
fig, ax = plt.subplots()
ax.plot(t, s)
inset_ax = ax.inset_axes([0.2, 0.6, 0.2, 0.2])
inset_ax.plot(t[:len(r)], r)
产生:

至关重要的是,min/ maxof分别t[:len(r)]是0/ 0.009。所以看起来xlim你申请的是什么让它看起来没有“缩放”
添加回答
举报
0/150
提交
取消
