我在用 1 到 5 的情绪绘制单词时遇到了问题['dotcom', 13, 12, 17, 6, 13], ['graelam', 1, 2, 3, 2, 0], ['oprahin', 1, 0, 0, 0, 0], ['jeffi', 2, 2, 3, 7, 0], ['assuar', 1, 0, 0, 1, 0], ['ausio', 0, 0, 0, 1, 0], ['sweeeeet', 2, 1, 0, 5, 7], ['atual', 3, 5, 8, 4, 4], ['estraing', 0, 0, 0, 0, 1], ['affilait', 1, 0, 0, 0, 0], ['radioshark', 8, 4, 9, 4, 3], ['illuminati', 53, 45, 52, 37, 12], ['providedth', 0, 1, 1, 0, 0], ['recategor', 5, 0, 1, 0, 0], ['redondo', 2, 2, 0, 6, 2], ['dybl', 1, 0, 1, 2, 0], ['gebhardt', 0, 1, 1, 2, 2], ['isanyway', 0, 1, 0, 0, 0],在每个列表中有单词并包含标签 [1,2,3,4,5] 的单词计数。我想绘制那些单词与不同标签的关系。我怎样才能做到这一点?谢谢你的主意
1 回答
达令说
TA贡献1821条经验 获得超6个赞
在我的解决方案中x-axis包含每个单词标签,并y-axis包含所属类别。代码如下所示:
import numpy as np
import matplotlib.pyplot as plt
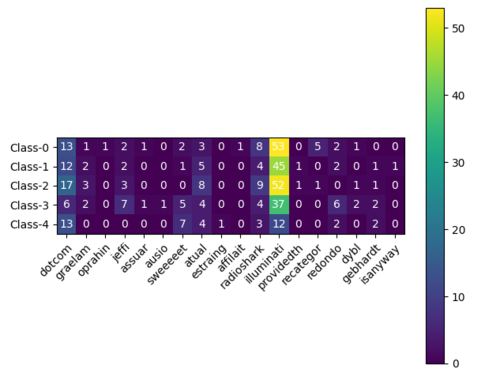
pred = [['dotcom', 13, 12, 17, 6, 13], \
['graelam', 1, 2, 3, 2, 0],\
['oprahin', 1, 0, 0, 0, 0],\
['jeffi', 2, 2, 3, 7, 0],\
['assuar', 1, 0, 0, 1, 0],\
['ausio', 0, 0, 0, 1, 0],\
['sweeeeet', 2, 1, 0, 5, 7],\
['atual', 3, 5, 8, 4, 4],\
['estraing', 0, 0, 0, 0, 1],\
['affilait', 1, 0, 0, 0, 0],\
['radioshark', 8, 4, 9, 4, 3],\
['illuminati', 53, 45, 52, 37, 12],\
['providedth', 0, 1, 1, 0, 0],\
['recategor', 5, 0, 1, 0, 0],\
['redondo', 2, 2, 0, 6, 2],\
['dybl', 1, 0, 1, 2, 0],\
['gebhardt', 0, 1, 1, 2, 2],\
['isanyway', 0, 1, 0, 0, 0]]
pred = np.asarray(pred)
predicted_val = pred[:,1:].astype(int)
predicted_val = np.transpose(predicted_val)
prediction_results = pred
word_list = pred[:,0].astype(str)
word_list = word_list.tolist()
classes = ['Class-0', 'Class-1', 'Class-2', 'Class-3', 'Class-4']
fig, ax = plt.subplots()
im = ax.imshow(predicted_val)
# We want to show all ticks...
ax.set_xticks(np.arange(len(word_list)))
ax.set_yticks(np.arange(len(classes)))
ax.set_xticklabels(word_list)
ax.set_yticklabels(classes)
# Rotate the tick labels and set their alignment.
plt.setp(ax.get_xticklabels(), rotation=45, ha="right",
rotation_mode="anchor")
# Loop over data dimensions and create text annotations.
for i in range(len(classes)):
for j in range(len(word_list)):
text = ax.text(j, i, predicted_val[i, j],
ha="center", va="center", color="w")
#ax.set_title("")
fig.tight_layout()
cbar = ax.figure.colorbar(im, ax=ax)
plt.show()
绘制的图:
添加回答
举报
0/150
提交
取消