我想用 seaborn 进行可视化并添加文本。这是我的代码:# barplot price by body-stylefig, ax = plt.subplots(figsize = (12,8))g = data[['body-style','price']].groupby(by = 'body- style').sum().reset_index().sort_values(by='price')x = g['body-style']y = g['price']ok = sns.barplot(x,y, ci = None)ax.set_title('Price By Body Style')def autolabel(rects): for idx,rect in enumerate(ok): height = rect.get_height() g.text(rect.get_x() + rect.get_width()/2., 0.2*height, g['price'].unique().tolist()[idx], ha='center', va='bottom', rotation=90)autolabel(ok)但我出错了:
1 回答
一只甜甜圈
TA贡献1836条经验 获得超5个赞
你需要做一些改变:
由于您已经创建了
ax,因此您需要sns.barplot(..., ax=ax).autolabel()需要以柱列表作为参数调用。使用 seaborn,您可以通过ax.patches.for idx,rect in enumerate(ok):不应该使用ok但是rects。你不能使用
g.text。g是一个数据框,没有功能.text。你需要ax.text。用作
g['price'].unique().tolist()[idx]要打印的文本与绘制的条形图没有任何关系。你可以改用height。
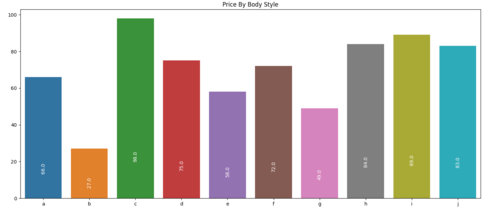
这是一些带有玩具数据的测试代码:
import matplotlib.pyplot as plt
import seaborn as sns
import numpy as np
fig, ax = plt.subplots(figsize=(12, 8))
g = data[['body-style','price']].groupby(by = 'body-style').sum().reset_index().sort_values(by='price')
x = g['body-style']
y = g['price']
# x = list('abcdefghij')
# y = np.random.randint(20, 100, len(x))
sns.barplot(x, y, ci=None, ax=ax)
ax.set_title('Price By Body Style')
def autolabel(rects):
for rect in rects:
height = rect.get_height()
ax.text(rect.get_x() + rect.get_width() / 2., 0.2 * height,
height,
ha='center', va='bottom', rotation=90, color='white')
autolabel(ax.patches)
plt.show()
PS:您可以通过参数将文本的字体大小更改为ax.text: ax.text(..., fontsize=14)。
添加回答
举报
0/150
提交
取消