1 回答
TA贡献1801条经验 获得超15个赞
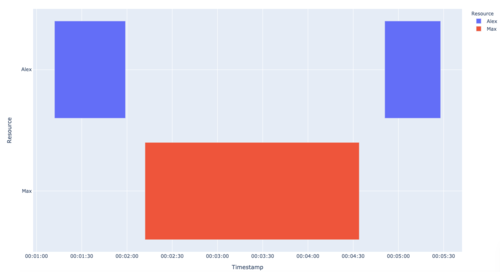
Plotly 甘特图仅适用于日期,但可能的解决方法是将日期添加1970-01-01到所有时间的开头,然后显示时间而不在图中显示日期。
import plotly.express as px
import pandas as pd
df = pd.DataFrame([
dict(Start='1970-01-01 00:01:12', Finish='1970-01-01 00:01:59', Resource="Alex"),
dict(Start='1970-01-01 00:04:51', Finish='1970-01-01 00:05:28', Resource="Alex"),
dict(Start='1970-01-01 00:02:12', Finish='1970-01-01 00:04:34', Resource="Max")
])
fig = px.timeline(df, x_start="Start", x_end="Finish", y="Resource", color="Resource"
)
fig.update_layout(xaxis=dict(
title='Timestamp',
tickformat = '%H:%M:%S',
))
fig.show()

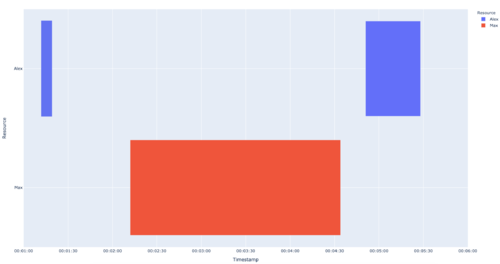
编辑:不幸的是,甘特图在不到 10 秒的时间间隔内中断,我不明白为什么。然而,我非常确定,在幕后,甘特图只不过是在图表上绘制的矩形,因此我们可以绘制这样一个小于 10 秒的间隔来实现类似的效果(除了没有悬停手动绘制的形状)
import plotly.express as px
import pandas as pd
df = pd.DataFrame([
# dict(Start='1970-01-01 00:01:12', Finish='1970-01-01 00:01:19', Resource="Alex"),
dict(Start='1970-01-01 00:04:51', Finish='1970-01-01 00:05:28', Resource="Alex"),
dict(Start='1970-01-01 00:02:12', Finish='1970-01-01 00:04:34', Resource="Max")
])
fig = px.timeline(df, x_start="Start", x_end="Finish", y="Resource", color="Resource"
)
# you can manually set the range as well
fig.update_layout(xaxis=dict(
title='Timestamp',
tickformat = '%H:%M:%S',
range = ['1970-01-01 00:01:00','1970-01-01 00:06:00']
))
# add a filled rectangle
fig.add_shape(
type="rect",
x0='1970-01-01 00:01:12',
y0=0.6,
x1='1970-01-01 00:01:19',
y1=1.4,
line=dict(color="rgb(98,115,241)"),
fillcolor="rgb(98,115,241)",
)
fig.show()

添加回答
举报
