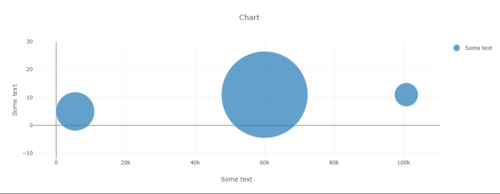
通过下面的代码,我尝试创建一个简单的气泡图。我创建了一个跟踪以便稍后扩展它: var t9 = { x: [100821], y: [11], name: 'Some text', text: ['Some text'], mode: ['markers'], marker: [{ size: [1531*10], sizeref: 2, sizemode: 'area' }] }; var data = [t9];var layout = { title: 'Chart', showlegend: true, xaxis: { title: 'Some text' }, yaxis: { title: 'Some text' }};var config = {responsive: true}Plotly.newPlot('plot', data, layout, config); Plotly.extendTraces( 'plot', { x: [[5491]], y: [[5]], text: [['Some text']], mode: [['markers']], marker: [[{ size: 123*100, sizeref: 2, sizemode: 'area' }]] }, [0]); Plotly.extendTraces( 'plot', { x: [[60022]], y: [[11]], text: [['Some text']], mode: [['markers']], marker: [[{ size: 982*100, sizeref: 2, sizemode: 'area' }]] }, [0]);<head> <!-- Plotly.js --> <script src="https://cdn.plot.ly/plotly-latest.min.js"></script></head><html> <body> <div id="plot"></div> </body></html>结果是这样的:正如您所看到的,标记不会占用该属性mode: ['markers']和所有属性markers:。知道如何获得像本页这样的结果吗? https://plotly.com/javascript/bubble-charts/
1 回答
慕侠2389804
TA贡献1719条经验 获得超6个赞
如果您使用extendTraces并想要更新属性,例如标记大小,您需要以字符串形式提供属性,例如,marker.size并且值必须是数组,就像新的 x 和 y 值一样。
Plotly.extendTraces(
'plot',
{
x: [[5491]],
y: [[5]],
'marker.size':[[40*100]]
}, [0]);
您的初始数据和属性应该是一个简单的数组或对象,而不是数组/对象的数组。
var t9 = {
x: [100821],
y: [11],
name: 'Some text',
text: 'Some text',
mode: 'markers',
marker: {
size: [15*100],
sizeref: 1,
sizemode: 'area'
}
};
var data = [t9];
var layout = {
title: 'Chart',
showlegend: true,
xaxis: {
title: 'Some text'
},
yaxis: {
title: 'Some text',
range: [-12, 30]
}
};
var config = {responsive: true}
Plotly.newPlot('plot', data, layout, config);
Plotly.extendTraces(
'plot',
{
x: [[5491]],
y: [[5]],
'marker.size':[[40*100]]
}, [0]);
Plotly.extendTraces(
'plot',
{
x: [[60022]],
y: [[11]],
'marker.size':[[200*100]]
}, [0]);
<head>
<script src="https://cdn.plot.ly/plotly-latest.min.js"></script>
</head>
<div id='plot'>
</div>
添加回答
举报
0/150
提交
取消