我一直在尝试在共享相同 x 轴的堆叠条形图顶部创建折线图。到目前为止,我已经想出了这段代码,但我在尝试完成折线图的剩余代码时卡住了几个小时,因为在转置数据后尝试引用折线图的列名称时遇到了 KeyError框架。#Slices the dataset to create stacked bar chartdf1 = df.iloc[1:6]plt.figure(1, figsize=(10,10))barchart = df1.T.plot(kind = 'bar', stacked = True)plt.twinx()linechart = plt.plot()
1 回答
弑天下
TA贡献1818条经验 获得超8个赞
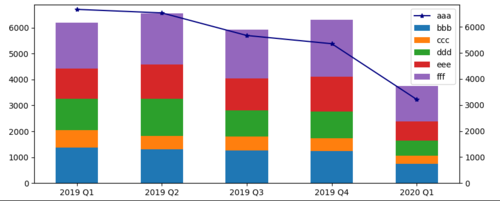
您可以使用第一列df.T,然后创建一个类似于条形图的 pandas 线图。下面的代码首先创建一个与问题中的数据类似的玩具数据框,以绘制条形图和对齐线图。两个情节的图例可以通过 组合get_legend_handles_labels()。请注意,pandas 绘图函数不返回绘图,而是ax返回创建绘图的 matplotlib。
import matplotlib.pyplot as plt
import numpy as np
import pandas as pd
N = 5
df = pd.DataFrame([np.random.randint(5000, 7000, N), np.random.randint(1200, 1400, N), np.random.randint(500, 700, N),
np.random.randint(900, 1500, N), np.random.randint(1100, 1400, N), np.random.randint(1700, 2300, N)],
columns=['2019 Q1', '2019 Q2', '2019 Q3', '2019 Q4', '2020 Q1'],
index=['aaa', 'bbb', 'ccc', 'ddd', 'eee', 'fff'])
df['2020 Q1'] *= 0.6
df1 = df.iloc[1:]
ax1 = df1.T.plot(kind='bar', stacked=True, rot=0)
ax2 = ax1.twinx()
df.T['aaa'].plot(kind='line', color='navy', marker='*', ls='-', ax=ax2)
ax2.set_ylim(ymin=0)
h1, l1 = ax1.get_legend_handles_labels()
h2, l2 = ax2.get_legend_handles_labels()
ax1.legend(h2 + h1, l2 + l1)
plt.tight_layout()
plt.show()
添加回答
举报
0/150
提交
取消