
如何实现下面的效果:
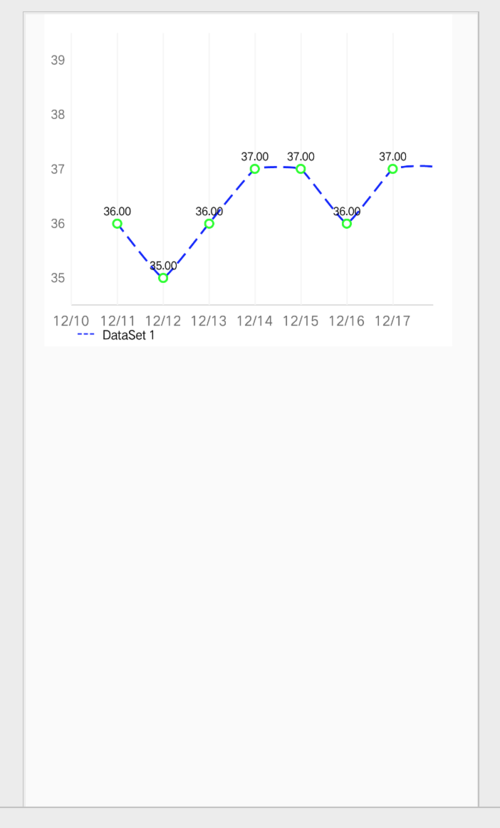
横坐标为日期,纵坐标是温度,温度在35-38度,数字为随机
private LineChart chart;
    public static  float  mXaxisLabelCount = 8;
    public static final int XAXIS_LABEL_COUNT_TOTAL = 60;
    public static final long DAY = 24 * 60 * 60 * 1000;

    @Override
    protected void onCreate(Bundle savedInstanceState) {
        super.onCreate(savedInstanceState);
        getWindow().setFlags(WindowManager.LayoutParams.FLAG_FULLSCREEN,
                WindowManager.LayoutParams.FLAG_FULLSCREEN);
        setContentView(R.layout.activity_linechart);

        setTitle("LineChartActivity1");

        {   // // Chart Style // //
            chart = (LineChart)findViewById(R.id.chart1);

            // background color
            chart.setBackgroundColor(Color.WHITE);

            // disable description text
            chart.getDescription().setEnabled(false);

            // enable touch gestures
            chart.setTouchEnabled(true);

            // set listeners
            chart.setDrawGridBackground(false);


            // enable scaling and dragging
            chart.setDragEnabled(true);
            chart.setScaleEnabled(true);
            // chart.setScaleXEnabled(true);
            // chart.setScaleYEnabled(true);

            // force pinch zoom along both axis
            chart.setPinchZoom(true);
        }

        XAxis xAxis;
        {   // // X-Axis Style // //
            xAxis = chart.getXAxis();
            xAxis.setYOffset(6f);
            xAxis.setXOffset(30f);
            // vertical grid lines
            xAxis.setDrawGridLines(true);
            xAxis.enableAxisLineDashedLine(10f, 0, 0);
            xAxis.setGridColor(Color.parseColor("#F5F5F5"));
            xAxis.setGridLineWidth(1);
            xAxis.setTextColor(Color.parseColor("#FF666666"));
            xAxis.setDrawAxisLine(true);
            xAxis.setAxisLineColor(Color.parseColor("#DDDDDD"));
            xAxis.setAxisLineWidth(1f);
            xAxis.setPosition(XAxis.XAxisPosition.BOTTOM);

            xAxis.setLabelCount((int)mXaxisLabelCount, false);
            xAxis.setTextSize(10);
            xAxis.setTextColor(Color.parseColor("#FF666666"));
            xAxis.setAxisMinimum(0f);
            xAxis.setAxisMaximum(XAXIS_LABEL_COUNT_TOTAL+0.1f);
        }
        final ArrayList<String> alxLabel = new ArrayList<>();


        YAxis yAxis;
        {   // // Y-Axis Style // //
            yAxis = chart.getAxisLeft();

            // disable dual axis (only use LEFT axis)
            chart.getAxisRight().setEnabled(false);
            yAxis.disableAxisLineDashedLine();
            yAxis.setDrawGridLines(false);
            yAxis.setDrawAxisLine(true);
            yAxis.setAxisLineColor(Color.parseColor("#DDDDDD"));
            yAxis.setTextColor(Color.parseColor("#FF666666"));
            yAxis.setAxisLineWidth(1);
            yAxis.setAxisMinimum(0f); // this replaces setStartAtZero(true)
            yAxis.setAxisMaximum(39.5f);
            // 描述y坐标有几个坐标点
            yAxis.setLabelCount(5, false);
            // axis range
            yAxis.setAxisMinimum(34.5f);
            xAxis.setTextSize(11);
        }


        final long curTime = System.currentTimeMillis();

        ArrayList<Entry> values = new ArrayList<>();
        for (int i = XAXIS_LABEL_COUNT_TOTAL - 1; i >= 0; i--) {
            long startTime = (curTime - DAY * i);
            String startTimeMMdd = CalendarUtil.formatMMdd(startTime);
            alxLabel.add(startTimeMMdd);

            Random rand = new Random();
            int j = rand.nextInt(3);
            float temDegree = 35.0f+j;
            Entry entry = new Entry(XAXIS_LABEL_COUNT_TOTAL - i, temDegree, null);
            values.add(entry);

        }

        xAxis.setValueFormatter(new IAxisValueFormatter() {
            @Override
            public String getFormattedValue(float v, AxisBase axisBase) {
                int x = (int) v;

                if (alxLabel.size() > x) {
                    return alxLabel.get((int) (v));
                } else {
                    return  CalendarUtil.formatMMdd(curTime);
                }

            }
        });

        setData(this, chart, values);
        float scale = (XAXIS_LABEL_COUNT_TOTAL + 1) / mXaxisLabelCount;
        Matrix m = new Matrix();
        m.postScale(scale, 1f);//两个参数分别是x,y轴的缩放比例。例如:将x轴的数据放大为之前的3倍
        chart.getViewPortHandler().refresh(m, chart, false);//将图表动画显示之前进行缩放
        chart.setScaleYEnabled(false);
        chart.setScaleXEnabled(false);

        // get the legend (only possible after setting data)
        Legend l = chart.getLegend();

        // draw legend entries as lines
        l.setForm(LegendForm.LINE);
    }


    private static void setData(final Context context, final LineChart chart, ArrayList values) {
        LineDataSet set1;
        if (chart.getData() != null &&
                chart.getData().getDataSetCount() > 0) {
            set1 = (LineDataSet) chart.getData().getDataSetByIndex(0);
            if(set1!=null) {
                set1.setValues(values);
                set1.notifyDataSetChanged();
            }
            chart.getData().notifyDataChanged();
            chart.notifyDataSetChanged();
        } else {
            // create a dataset and give it a type
            set1 = new LineDataSet(values, "DataSet 1");
            set1.setMode(LineDataSet.Mode.CUBIC_BEZIER);
            set1.setDrawIcons(false);
            // draw dashed line
            set1.enableDashedLine(30f, 15f, 5f);
            // black lines and points
            set1.setColor(Color.BLUE);
            set1.setCircleColor(Color.GREEN);
            // line thickness and point size
            set1.setLineWidth(1.5f);
            set1.setCircleRadius(4f);
            set1.setCircleHoleRadius(2.5F);
            // draw points as solid circles
            set1.setDrawCircleHole(true);
            // customize legend entry
            set1.setFormLineWidth(1f);
            set1.setFormLineDashEffect(new DashPathEffect(new float[]{10f, 5f}, 0f));
            set1.setFormSize(15.f);
            // text size of values
            set1.setValueTextSize(9f);
            // draw selection line as dashed
            set1.enableDashedHighlightLine(10f, 5f, 0f);
            set1.setHighlightEnabled(false);
            // set the filled area
            set1.setDrawFilled(false);
            set1.setFillFormatter(new IFillFormatter() {
                @Override
                public float getFillLinePosition(ILineDataSet dataSet, LineDataProvider dataProvider) {
                    return chart.getAxisLeft().getAxisMinimum();
                }
            });

            set1.setCubicIntensity(0.01f);

            if (Utils.getSDKInt() >= 18) {
                // drawables only supported on api level 18 and above
                Drawable drawable = ContextCompat.getDrawable(context, R.drawable.ca_fade_red);
                set1.setFillDrawable(drawable);
            } else {
                set1.setFillColor(Color.BLACK);
            }

//            set1.isDrawLine = true;
//            set1.isDrawValues = true;
            ArrayList<ILineDataSet> dataSets = new ArrayList<>();
            dataSets.add(set1); // add the data sets
            // create a data object with the data sets
            LineData data = new LineData(dataSets);
            // set data
            chart.setData(data);
        }
    }
重点的几句讲解一下:
xAxis.setAxisLineColor(Color.parseColor("#DDDDDD"));x轴的颜色
xAxis.setTextColor(Color.parseColor("#FF666666"));x轴标签的字体颜色
xAxis.setGridColor(Color.parseColor("#F5F5F5"));x轴网格线的颜色
xAxis.setLabelCount((int)mXaxisLabelCount, false);
x轴每屏有几个标签
xAxis.setAxisMaximum(XAXIS_LABEL_COUNT_TOTAL+0.1f);
x轴最多有几个标签
yAxis.setLabelCount(5, false);
y轴有几个标签
数据的构造:
ArrayList<Entry> values = new ArrayList<>();
for (int i = XAXIS_LABEL_COUNT_TOTAL - 1; i >= 0; i--) {
    long startTime = (curTime - DAY * i);
    String startTimeMMdd = CalendarUtil.formatMMdd(startTime);
    alxLabel.add(startTimeMMdd);

    Random rand = new Random();
    int j = rand.nextInt(3);
    float temDegree = 35.0f+j;
    Entry entry = new Entry(XAXIS_LABEL_COUNT_TOTAL - i, temDegree, null);
    values.add(entry);

}
x轴自定义坐标标签:
xAxis.setValueFormatter(new IAxisValueFormatter() {
    @Override
    public String getFormattedValue(float v, AxisBase axisBase) {
        int x = (int) v;

        if (alxLabel.size() > x) {
            return alxLabel.get((int) (v));
        } else {
            return  CalendarUtil.formatMMdd(curTime);
        }

    }
});
为12/10,12/11之类的
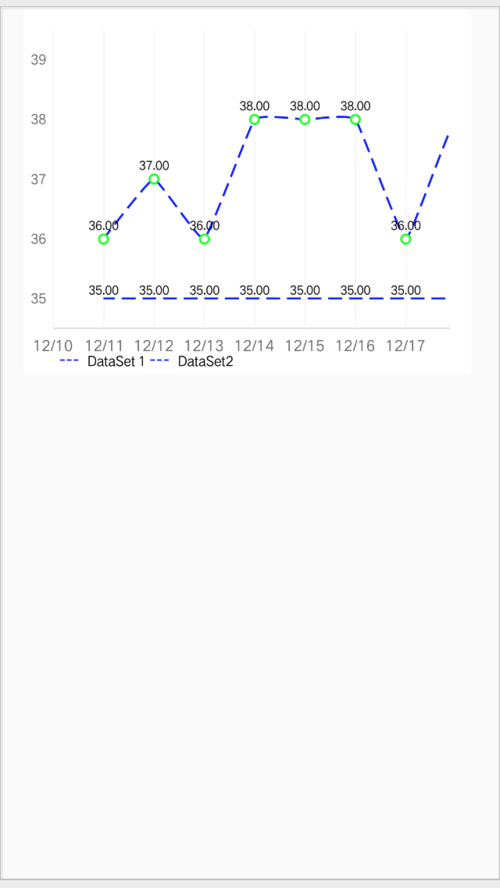
如何支持画两个折线呢:
private LineChart chart;
public static  float  mXaxisLabelCount = 8;
public static final int XAXIS_LABEL_COUNT_TOTAL = 60;
public static final long DAY = 24 * 60 * 60 * 1000;

@Override
protected void onCreate(Bundle savedInstanceState) {
    super.onCreate(savedInstanceState);
    getWindow().setFlags(WindowManager.LayoutParams.FLAG_FULLSCREEN,
            WindowManager.LayoutParams.FLAG_FULLSCREEN);
    setContentView(R.layout.activity_linechart);

    setTitle("LineChartActivity1");

    {   // // Chart Style // //
        chart = (LineChart)findViewById(R.id.chart1);

        // background color
        chart.setBackgroundColor(Color.WHITE);

        // disable description text
        chart.getDescription().setEnabled(false);

        // enable touch gestures
        chart.setTouchEnabled(true);

        // set listeners
        chart.setDrawGridBackground(false);


        // enable scaling and dragging
        chart.setDragEnabled(true);
        chart.setScaleEnabled(true);
        // chart.setScaleXEnabled(true);
        // chart.setScaleYEnabled(true);

        // force pinch zoom along both axis
        chart.setPinchZoom(true);
    }

    XAxis xAxis;
    {   // // X-Axis Style // //
        xAxis = chart.getXAxis();
        xAxis.setYOffset(6f);
        xAxis.setXOffset(30f);
        // vertical grid lines
        xAxis.setDrawGridLines(true);
        xAxis.enableAxisLineDashedLine(10f, 0, 0);
        xAxis.setGridColor(Color.parseColor("#F5F5F5"));
        xAxis.setGridLineWidth(1);
        xAxis.setTextColor(Color.parseColor("#FF666666"));
        xAxis.setDrawAxisLine(true);
        xAxis.setAxisLineColor(Color.parseColor("#DDDDDD"));
        xAxis.setAxisLineWidth(1f);
        xAxis.setPosition(XAxis.XAxisPosition.BOTTOM);

        xAxis.setLabelCount((int)mXaxisLabelCount, false);
        xAxis.setTextSize(10);
        xAxis.setTextColor(Color.parseColor("#FF666666"));
        xAxis.setAxisMinimum(0f);
        xAxis.setAxisMaximum(XAXIS_LABEL_COUNT_TOTAL+0.1f);
    }
    final ArrayList<String> alxLabel = new ArrayList<>();


    YAxis yAxis;
    {   // // Y-Axis Style // //
        yAxis = chart.getAxisLeft();

        // disable dual axis (only use LEFT axis)
        chart.getAxisRight().setEnabled(false);
        yAxis.disableAxisLineDashedLine();
        yAxis.setDrawGridLines(false);
        yAxis.setDrawAxisLine(true);
        yAxis.setAxisLineColor(Color.parseColor("#DDDDDD"));
        yAxis.setTextColor(Color.parseColor("#FF666666"));
        yAxis.setAxisLineWidth(1);
        yAxis.setAxisMinimum(0f); // this replaces setStartAtZero(true)
        yAxis.setAxisMaximum(39.5f);
        // 描述y坐标有几个坐标点
        yAxis.setLabelCount(5, false);
        // axis range
        yAxis.setAxisMinimum(34.5f);
        xAxis.setTextSize(11);
    }


    final long curTime = System.currentTimeMillis();
    ArrayList<Entry> valuesLove = new ArrayList<>();

    ArrayList<Entry> values = new ArrayList<>();
    for (int i = XAXIS_LABEL_COUNT_TOTAL - 1; i >= 0; i--) {
        long startTime = (curTime - DAY * i);
        String startTimeMMdd = CalendarUtil.formatMMdd(startTime);
        alxLabel.add(startTimeMMdd);

        Random rand = new Random();
        int j = rand.nextInt(3);
        float temDegree = 36.0f+j;
        Entry entry = new Entry(XAXIS_LABEL_COUNT_TOTAL - i, temDegree, null);
        values.add(entry);

        Entry entry1 = new Entry(XAXIS_LABEL_COUNT_TOTAL - i, 35f, null);
        valuesLove.add(entry1);

    }

    xAxis.setValueFormatter(new IAxisValueFormatter() {
        @Override
        public String getFormattedValue(float v, AxisBase axisBase) {
            int x = (int) v;

            if (alxLabel.size() > x) {
                return alxLabel.get((int) (v));
            } else {
                return  CalendarUtil.formatMMdd(curTime);
            }

        }
    });

    setData1(this, chart, values,valuesLove);
    float scale = (XAXIS_LABEL_COUNT_TOTAL + 1) / mXaxisLabelCount;
    Matrix m = new Matrix();
    m.postScale(scale, 1f);//两个参数分别是x,y轴的缩放比例。例如:将x轴的数据放大为之前的3倍
    chart.getViewPortHandler().refresh(m, chart, false);//将图表动画显示之前进行缩放
    chart.setScaleYEnabled(false);
    chart.setScaleXEnabled(false);

    // get the legend (only possible after setting data)
    Legend l = chart.getLegend();

    // draw legend entries as lines
    l.setForm(LegendForm.LINE);
}

private static void setData1(final Context context, final LineChart chart, ArrayList values ,ArrayList valuesLove) {
    LineDataSet set1;
    LineDataSet set2;
    if (chart.getData() != null &&
            chart.getData().getDataSetCount() > 0) {
        set1 = (LineDataSet) chart.getData().getDataSetByIndex(0);
        set2 = (LineDataSet) chart.getData().getDataSetByIndex(1);
        if(set1!=null&&set2!=null) {
            set1.setValues(values);
            set2.setValues(valuesLove);
            set1.notifyDataSetChanged();
            set2.notifyDataSetChanged();
        }
        chart.getData().notifyDataChanged();
        chart.notifyDataSetChanged();
    } else {
        // create a dataset and give it a type
        set1 = new LineDataSet(values, "DataSet 1");
        set1.setMode(LineDataSet.Mode.CUBIC_BEZIER);
        set1.setDrawIcons(false);
        // draw dashed line
        set1.enableDashedLine(30f, 15f, 5f);
        // black lines and points
        set1.setColor(Color.BLUE);
        set1.setCircleColor(Color.GREEN);
        // line thickness and point size
        set1.setLineWidth(1.5f);
        set1.setCircleRadius(4f);
        set1.setCircleHoleRadius(2.5F);
        // draw points as solid circles
        set1.setDrawCircleHole(true);
        // customize legend entry
        set1.setFormLineWidth(1f);
        set1.setFormLineDashEffect(new DashPathEffect(new float[]{10f, 5f}, 0f));
        set1.setFormSize(15.f);
        // text size of values
        set1.setValueTextSize(9f);
        // draw selection line as dashed
        set1.enableDashedHighlightLine(10f, 5f, 0f);
        set1.setHighlightEnabled(false);
        // set the filled area
        set1.setDrawFilled(false);
        set1.setFillFormatter(new IFillFormatter() {
            @Override
            public float getFillLinePosition(ILineDataSet dataSet, LineDataProvider dataProvider) {
                return chart.getAxisLeft().getAxisMinimum();
            }
        });

        set2 = new LineDataSet(valuesLove, "DataSet2");
        set1.setCubicIntensity(0.01f);
        set2.setCubicIntensity(0.01f);
        set2.setMode(LineDataSet.Mode.CUBIC_BEZIER);
        set2.setDrawIcons(false);
        // draw dashed line
        set2.enableDashedLine(30f, 15f, 5f);
        // black lines and points
        set2.setColor(Color.BLUE);
        set2.setCircleColor(Color.GREEN);
        // line thickness and point size
        set2.setLineWidth(1.5f);
        set2.setCircleRadius(4f);
        set2.setCircleHoleRadius(2.5F);
        // draw points as solid circles
        set2.setDrawCircleHole(true);
        // customize legend entry
        set2.setFormLineWidth(1f);
        set2.setFormLineDashEffect(new DashPathEffect(new float[]{10f, 5f}, 0f));
        set2.setFormSize(15.f);
        // text size of values
        set2.setValueTextSize(9f);
        // draw selection line as dashed
        set2.enableDashedHighlightLine(10f, 5f, 0f);
        set2.setHighlightEnabled(false);
        // set the filled area
        set2.setDrawFilled(false);
        set2.setFillFormatter(new IFillFormatter() {
            @Override
            public float getFillLinePosition(ILineDataSet dataSet, LineDataProvider dataProvider) {
                return chart.getAxisLeft().getAxisMinimum();
            }
        });

        if (Utils.getSDKInt() >= 18) {
            // drawables only supported on api level 18 and above
            Drawable drawable = ContextCompat.getDrawable(context, R.drawable.ca_fade_red);
            set1.setFillDrawable(drawable);
            set2.setFillDrawable(drawable);
        } else {
            set1.setFillColor(Color.BLACK);
            set2.setFillColor(Color.BLACK);
        }
        set2.setDrawCircles(false);
        set2.setDrawValues(true);
        ArrayList<ILineDataSet> dataSets = new ArrayList<>();
        dataSets.add(set1); // add the data sets
        dataSets.add(set2); // add the data sets
        // create a data object with the data sets
        LineData data = new LineData(dataSets);
        // set data
        chart.setData(data);
    }
}
关键是:
ArrayList<ILineDataSet> dataSets = new ArrayList<>();
        dataSets.add(set1); // add the data sets
        dataSets.add(set2); // add the data sets
点击查看更多内容
为 TA 点赞
评论
共同学习,写下你的评论
评论加载中...
作者其他优质文章
正在加载中


感谢您的支持,我会继续努力的~
扫码打赏,你说多少就多少
赞赏金额会直接到老师账户
支付方式
打开微信扫一扫,即可进行扫码打赏哦