Hystrix Dashboard:断路器执行监控
SpringBoot实战电商项目mall(20k+star)地址:https://github.com/macrozheng/mall
摘要
Hystrix Dashboard 是Spring Cloud中查看Hystrix实例执行情况的一种仪表盘组件,支持查看单个实例和查看集群实例,本文将对其用法进行详细介绍。
简介
Hystrix提供了Hystrix Dashboard来实时监控HystrixCommand方法的执行情况。 Hystrix Dashboard可以有效地反映出每个Hystrix实例的运行情况,帮助我们快速发现系统中的问题,从而采取对应措施。
Hystrix 单个实例监控
我们先通过使用Hystrix Dashboard监控单个Hystrix实例来了解下它的使用方法。
创建一个hystrix-dashboard模块
用来监控hystrix实例的执行情况。
- 在pom.xml中添加相关依赖:
<dependency>
    <groupId>org.springframework.cloud</groupId>
    <artifactId>spring-cloud-starter-netflix-eureka-client</artifactId>
</dependency>
<dependency>
    <groupId>org.springframework.cloud</groupId>
    <artifactId>spring-cloud-starter-netflix-hystrix-dashboard</artifactId>
</dependency>
<dependency>
    <groupId>org.springframework.boot</groupId>
    <artifactId>spring-boot-starter-actuator</artifactId>
</dependency>
- 在application.yml进行配置:
server:
  port: 8501
spring:
  application:
    name: hystrix-dashboard
eureka:
  client:
    register-with-eureka: true
    fetch-registry: true
    service-url:
      defaultZone: http://localhost:8001/eureka/
- 在启动类上添加@EnableHystrixDashboard来启用监控功能:
@EnableHystrixDashboard
@EnableDiscoveryClient
@SpringBootApplication
public class HystrixDashboardApplication {

    public static void main(String[] args) {
        SpringApplication.run(HystrixDashboardApplication.class, args);
    }

}
启动相关服务
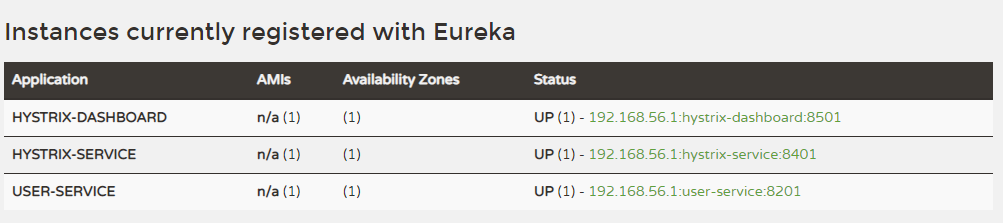
这次我们需要启动如下服务:eureka-server、user-service、hystrix-service、hystrix-dashboard,启动后注册中心显示如下。
Hystrix实例监控演示
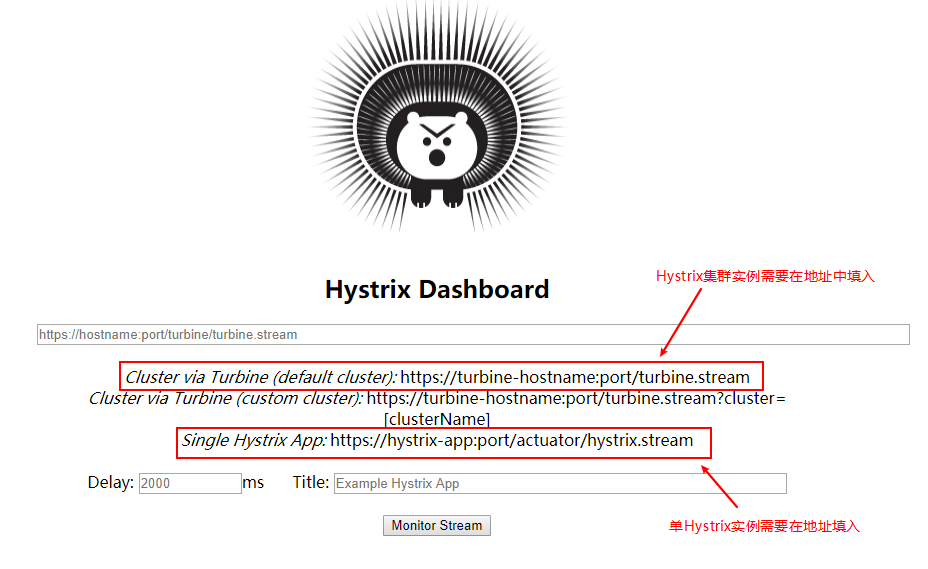
- 访问Hystrix Dashboard:http://localhost:8501/hystrix
- 填写好信息后点击监控按钮,这里我们需要注意的是,由于我们本地不支持https,所以我们的地址需要填入的是http,否则会无法获取监控信息;
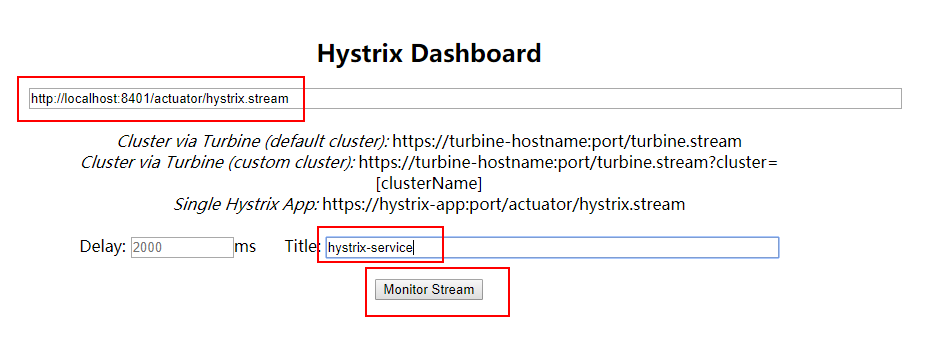
- 还有一点值得注意的是,被监控的hystrix-service服务需要开启Actuator的hystrix.stream端点,配置信息如下:
management:
  endpoints:
    web:
      exposure:
        include: 'hystrix.stream' #暴露hystrix监控端点
- 调用几次hystrix-service的接口:http://localhost:8401/user/testCommand/1
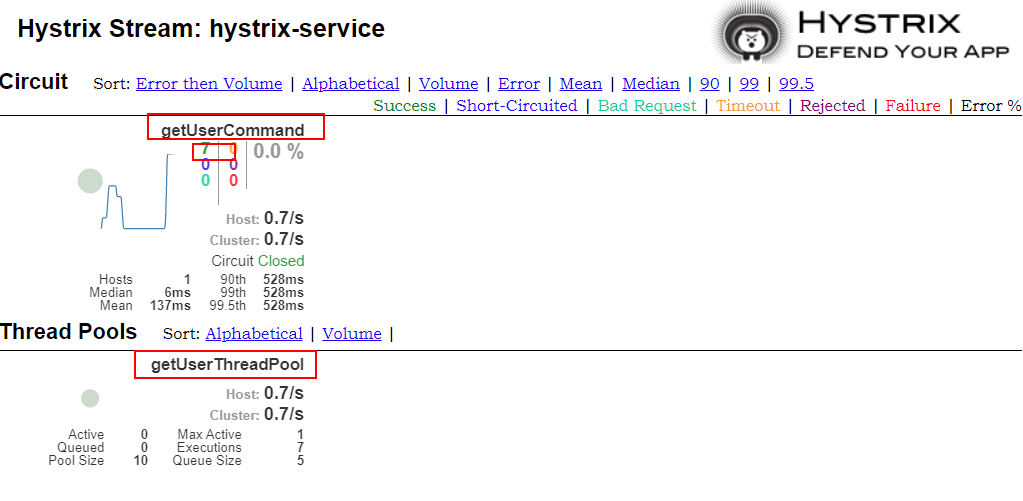
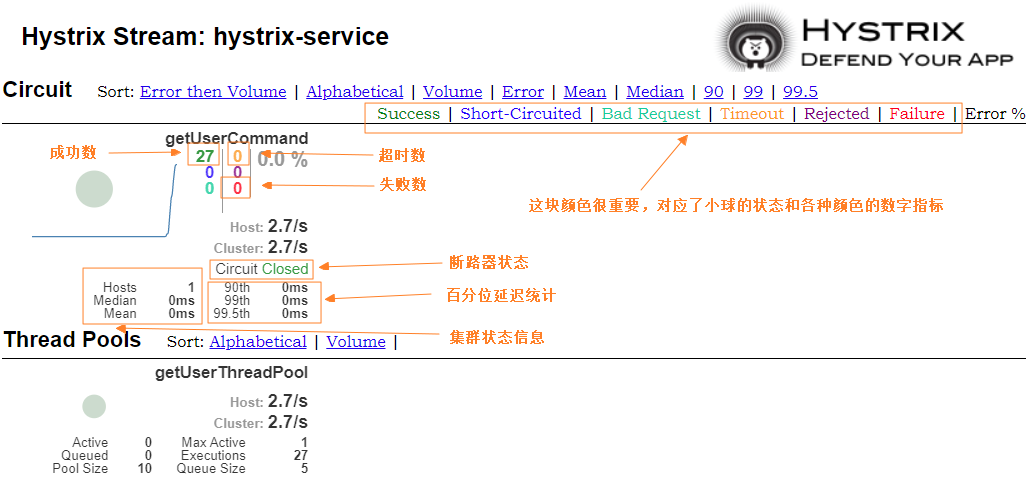
- 可以发现曾经我们在@HystrixCommand中添加的commandKey和threadPoolKey属性都显示在上面了,并且有7次调用都成功了。
Hystrix Dashboard 图表解读
图表解读如下,需要注意的是,小球代表该实例健康状态及流量情况,颜色越显眼,表示实例越不健康,小球越大,表示实例流量越大。曲线表示Hystrix实例的实时流量变化。
Hystrix 集群实例监控
这里我们使用Turbine来聚合hystrix-service服务的监控信息,然后我们的hystrix-dashboard服务就可以从Turbine获取聚合好的监控信息展示给我们了。
创建一个turbine-service模块
用来聚合hystrix-service的监控信息。
- 在pom.xml中添加相关依赖:
<dependency>
    <groupId>org.springframework.cloud</groupId>
    <artifactId>spring-cloud-starter-netflix-eureka-client</artifactId>
</dependency>
<dependency>
    <groupId>org.springframework.cloud</groupId>
    <artifactId>spring-cloud-starter-netflix-turbine</artifactId>
</dependency>
<dependency>
    <groupId>org.springframework.boot</groupId>
    <artifactId>spring-boot-starter-actuator</artifactId>
</dependency>
- 在application.yml进行配置,主要是添加了Turbine相关配置:
server:
  port: 8601
spring:
  application:
    name: turbine-service
eureka:
  client:
    register-with-eureka: true
    fetch-registry: true
    service-url:
      defaultZone: http://localhost:8001/eureka/
turbine:
  app-config: hystrix-service #指定需要收集信息的服务名称
  cluster-name-expression: new String('default') #指定服务所属集群
  combine-host-port: true #以主机名和端口号来区分服务
- 在启动类上添加@EnableTurbine来启用Turbine相关功能:
@EnableTurbine
@EnableDiscoveryClient
@SpringBootApplication
public class TurbineServiceApplication {

    public static void main(String[] args) {
        SpringApplication.run(TurbineServiceApplication.class, args);
    }

}
启动相关服务
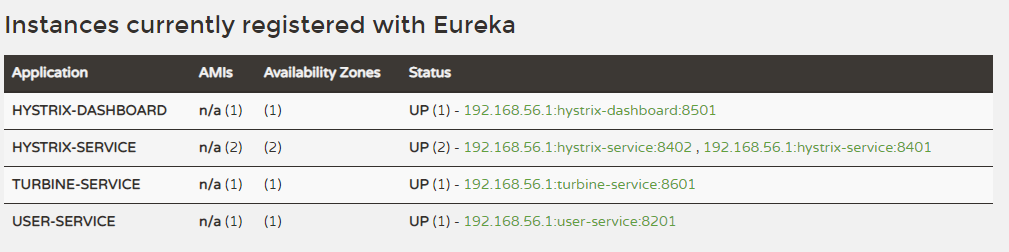
使用application-replica1.yml配置再启动一个hystrix-service服务,启动turbine-service服务,此时注册中心显示如下。
Hystrix集群监控演示
-
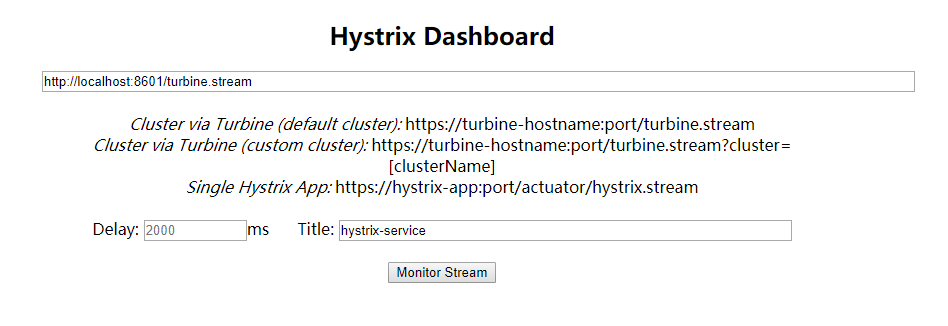
访问Hystrix Dashboard:http://localhost:8501/hystrix
-
添加集群监控地址,需要注意的是我们需要添加的是turbine-service的监控端点地址:
- 调用几次hystrix-service的接口:http://localhost:8401/user/testCommand/1以及http://localhost:8402/user/testCommand/1
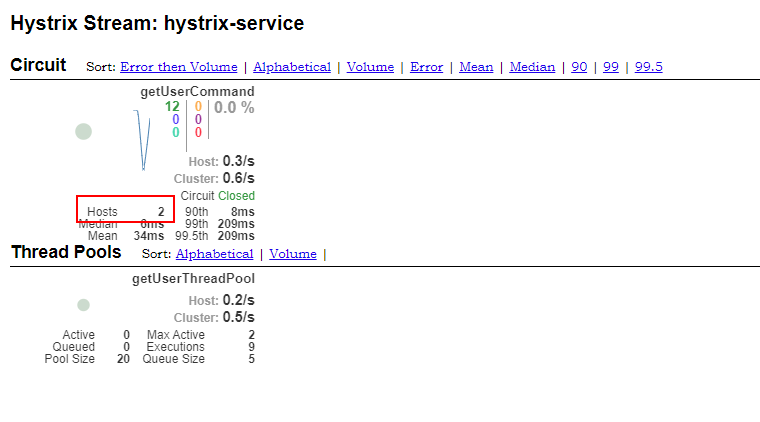
- 可以看到我们的Hystrix实例数量变成了两个。
使用到的模块
springcloud-learning
├── eureka-server -- eureka注册中心
├── user-service -- 提供User对象CRUD接口的服务
├── hystrix-service -- hystrix服务调用测试服务
├── turbine-service -- 聚合收集hystrix实例监控信息的服务
└── hystrix-dashboard -- 展示hystrix实例监控信息的仪表盘
项目源码地址
关于作者
macrozheng 【id:macrozheng】
专注Java技术分享,mall项目全套学习教程连载中,作者Github项目mall(20k+star)
共同学习,写下你的评论
评论加载中...
作者其他优质文章