SpringBoot集成Freemarker模板生成Echarts图片(三)

紧接着前面两篇,本篇采用Freemarker模板来生成Echarts图片。
一. 项目结构
二. Freemarker模板
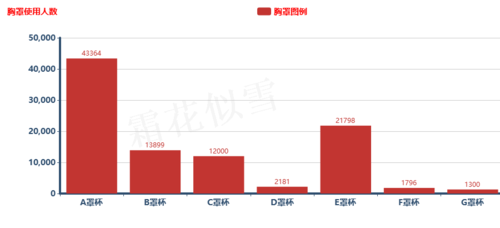
(1)柱状图
{
    "title": {
        "text": "${title}",
        "textStyle": {
            "color": "red",
            "fontSize": 15,
            "fontWeight": "bolder"
        }
    },
    "tooltip": {
        "formatter": "{a}<br/>{b} : {c}",
        "show": true
    },
    "legend": {
        "textStyle": {
            "color": "red",
            "fontSize": 15,
            "fontWeight": "bolder"
        },
    "data": ["${legend}"]
    },
    "xAxis": [{
        "type": "category",
        "axisLabel": {
            "show": true,
            "textStyle": {
                "fontSize": 15,
                "fontWeight": "bolder"
            }
        },
        "axisLine":{
            "lineStyle":{
                "color": "#315070",
                "width":4
            }
        },
        "data": ${category}

    }],
    "yAxis": [{
        "type": "value",
            "axisLabel": {
                "show": true,
                "textStyle": {
                    "fontSize": 15,
                    "fontWeight": "bolder"
                }
            },
        "axisLine":{
            "lineStyle":{
                "color":"#315070",
                "width":4
            }
        }
    }],
    "series": [{
        "name": "${legend}",
        "data": ${values},
        "type": "bar",
        "label": {
            "normal": {
                "color": "green",
                "fontSize": 15,
                "fontWeight": "bolder",
                "show": true,
                "position": "top"
            }
        }
    }]
}
(2)渐变色柱状图
{
    "title": {
        "text": "${title}",
        "textStyle": {
            "color": "red",
            "fontSize": 15,
            "fontWeight": "bolder"
        }
    },
    "toolbox": {
        "feature": {},
        "show": true
    },
    "tooltip": {
        "formatter": "{a}<br/>{b} : {c}",
        "show": true
    },
    "legend": {
        "textStyle": {
            "color": "red",
            "fontSize": 15,
            "fontWeight": "bolder"
        },
        "data": ["${legend}"]
    },
    "xAxis": [{
        "type": "category",
        "axisLabel": {
            "show": true,
            "textStyle": {
                "fontSize": 15,
                "fontWeight": "bolder"
            }
        },
        "axisLine":{
            "lineStyle":{
            "color":'#315070',
            "width":4
            }
        },
        "data": ${category}
    }],
    "yAxis": [{
        "type": "value",
        "axisLabel": {
            "show": true,
            "textStyle": {
                "fontSize": 15,
                "fontWeight": "bolder"
            }
        },
        "axisLine":{
            "show":true,
            "lineStyle":{
                "color":'#315070',
                "width":4
            }
        },
        "axisTick": {
            "show": true
        }
    }],
    "series": [{
        "name": "${legend}",
        "type": "bar",
        "label": {
            "normal": {
                "color": "red",
                "fontSize": 15,
                "fontWeight": "bolder",
                "show": true,
                "position": "top"
            }
        },
        "data":${values},
        "itemStyle": "__itemStyle"
    }]
}
(3)折线图
{
    "title": {
        "text": "${title}",
        "subtext": "",
        "textStyle": {
            "color": "red",
            "fontSize": 15,
            "fontWeight": "bolder"
        },
        "x": "left"
    },
    "tooltip": {
        "trigger": "axis"
    },
    "legend": {
        "textStyle": {
            "color": "red",
            "fontSize": 15,
            "fontWeight": "bolder"
        },
        "data": ["${legend}"]
    },
    "xAxis": [{
        "type": "category",
        "axisLabel": {
            "show": true,
            "textStyle": {
                "fontSize": 15,
                "fontWeight": "bolder"
            }
        },
        "axisLine":{
            "lineStyle":{
                "color":"#315070",
                "width":4
            }
        },
        "boundaryGap": false,
        "data": ${category}
    }],
    "yAxis": [{
        "type": "value",
        "axisLabel": {
            "show": true,
            "textStyle": {
                "fontSize": 15,
                "fontWeight": "bolder"
            }
        },
        "axisLine":{
            "lineStyle":{
                "color":"#315070",
                "width":4
            }
        }
    }],
    "series": [{
        "smooth": true,
        "dataFilter": "nearest",
        "lineStyle": {
            "color": "red",
            "width": 4
        },
        "legendHoverLink": true,
        "name": "${legend}",
        "type": "line",
        "stack": "总量",
        "symbolSize": "15",
        "showAllSymbol": true,
        "label": {
            "normal": {
                "color": "green",
                "show": true,
                "position": "right"
            }
        },
        "data": ${values}
    }]
}
(4)饼图
{
    "calculable": true,
    "legend": {
        "data": ${types},
        "orient": "vertical",
        "x": "left",
        "textStyle": {
            "color": "red",
            "fontSize": 15,
            "fontWeight": "bolder"
        }
    },
    "series": [{
        "center": ["50%", "60%"],
        "data": ${datas},
        "name": "${title}",
        "radius": "65%",
        "type": "pie",
        "avoidLabelOverlap": true,
        "label": {
            "normal": {
                "show": true,
                "position": "top",
                "textStyle": {
                    "color":"red",
                    "fontSize": "15",
                    "fontWeight": "bold"
                }
            },
            "emphasis": {
                "show": true,
                "textStyle": {
                    "fontSize": "20",
                    "fontWeight": "bold"
                }
            }
        },
        "labelLine": {
            "normal": {
                "show": true
            }
        }
    }],
    "title": {
        "subtext": "",
        "text": "${title}",
        "x": "center",
        "textStyle": {
            "color": "green",
            "fontSize": 20,
            "fontWeight": "bolder"
        }
    },
    "toolbox": {
        "feature": {
            "mark": {
                "lineStyle": {
                    "color": "#1e90ff",
                    "type": "dashed",
                    "width": 2
                },
                "show": true
            },
            "dataView": {
                "lang": ["数据视图", "关闭", "刷新"],
                "readOnly": false,
                "show": true,
                "title": "数据视图"
            },
            "magicType": {
                "show": true,
                "title": {
                    "bar": "柱形图切换",
                    "stack": "堆积",
                    "tiled": "平铺",
                    "line": "折线图切换"
                },
                "type": ["pie", "funnel"]
            },
            "restore": {
                "show": true,
                "title": "还原"
            },
            "saveAsImage": {
                "lang": ["点击保存"],
                "show": true,
                "title": "保存为图片",
                "type": "png"
            }
        },
        "show": true
    },
    "tooltip": {
        "formatter": "{a} <br/>{b} : {c} ({d}%)",
        "trigger": "item"
    }
}
三.插件js(
(1)echarts-util-one.js
phantom.outputEncoding = "gbk";// 为防止输出中文时出现乱码,可设置输出编码格式,写在最顶部
var params = require('system');// 获取系统参数
var server = require('webserver').create(); // 服务端
var port = params.args[3];// 端口,与启动命令有关,不一定是3
var listen = server.listen(port, function(request, response) {// 监听端口
    var args = serverGetArgs(request);// 得到网络请求参数
    args.response = response;
    methodDis(args);
});
var jslib = {
    jquery : phantom.libraryPath + '/lib/jquery-3.2.1.min.js',
    echarts : phantom.libraryPath + '/lib/echarts.min.js',
    china : phantom.libraryPath + '/lib/china.js',
};
/**
 * 请求分发
 *
 * @author liansh
 * @data 2019年9月19日 下午11:32:59
 * @param args
 */
function methodDis(args) {
    if (args.reqMethod == "table") {
        table(args);
    } else if (args.reqMethod == "echarts") {
        echarts(args);
    }
    if (args.exit == "true") {
        writeResponse(args.response, {
            error_no : 0
        });
        phantom.exit();
    }
}
function table(args) {
    var page = require('webpage').create();// 打开页面
    // 设置分辨率
    page.viewportSize = {
        width : 1000,
        height : 1200
    };
    // 打开页面
    page.open(args.url || 'http://127.0.0.1:8080/hello', function(status) {
        if (status == "fail") {
            writeResponse(args.response, {
                error_no : -1
            });
            return;
        }
        page.injectJs(jslib.jquery);
        var tableheight = page.evaluate(function() {
            return $('body').height() + 20;
        });
        // 定义剪切范围
        page.clipRect = {
            top : 0,
            left : 0,
            width : 1000,
            height : tableheight
        };
        // var base64 = 'data:image/png;base64,' + page.renderBase64('png');
        page.render(args.file);// 将整个page保存为文件,可以是png,jpg, gif,pdf
        page.close();
        writeResponse(args.response, {
            error_no : 0
        });
    });
    page.onError = function(msg, trace) {
        writeResponse(args.response, {
            error_no : -1,
            error_info : trace
        });
    };
}
function echarts(args) {
    var page = require('webpage').create(); // 客户端
    page.open("about:blank", function(status) {// 空白页
        /**
         * 报错{"file":"undefined","line":3,"function":""},{"file":"","line":18,"function":""}
         * "file":"undefined" 为所引用的jslib文件路径不对,需要重新检查路径
         */
        page.injectJs(jslib.jquery);
        page.injectJs(jslib.echarts);
        page.injectJs(jslib.china);
        var pageBody = page.evaluate(function(args) {
            // 动态加载js,获取options数据  实现渐变效果
            var itemStyle = '{"normal":{"color" : new echarts.graphic.LinearGradient(0, 0, 0, 1, [ '
                + '{offset : 0,    color : "#83bff6"}, {offset : 0.5,color : "#188df0"}, {offset : 1,color : "#188df0"} ])}}';
            // 动态加载js,获取options数据
            $('<script>').attr('type', 'text/javascript').html('var options =' //
                + JSON.stringify(args.opt).replace('\"__itemStyle"', itemStyle)).appendTo(document.head);
            // 取消动画,否则生成图片过快,会出现无数据
            if (options !== undefined) {
                options.animation = false;
            }
            // body背景设置为白色
            $(document.body).css('backgroundColor', 'white');
            // echarts容器
            var container = $("<div>").attr('id', 'container').css({
                width : args.width,
                height : args.height
            }).appendTo(document.body);
            var eChart = echarts.init(container[0]);
            eChart.setOption(options);
        }, args);
        // 定义剪切范围
        page.clipRect = {
            top : 0,
            left : 0,
            width : args.width - 100,
            height : args.height + 10
        };
        // var base64 = 'data:image/png;base64,' + page.renderBase64('png');
        // writeResponse(args.response, {// 返回给http请求
        // error_no : 0,
        // base64 : base64
        // });
        page.render(args.file);// 将整个page保存为文件,可以是png,jpg, gif,pdf
        page.close();
        writeResponse(args.response, {
            error_no : 0
        });
    });
    page.onError = function(msg, trace) {
        writeResponse(args.response, {
            error_no : -1,
            error_info : trace
        });
    };
}
function writeResponse(response, msg) {
    response.write(JSON.stringify(msg || {
        error_no : 0
    }));
    response.close();
}
/**
 * 获取请求参数
 *
 * @author liansh
 * @data 2019年9月19日 下午11:27:16
 * @param request
 * @returns
 */
function serverGetArgs(request) {
    var args = {};
    if ('GET' === request.method) {
        var index = request.url.indexOf('?');
        if (index !== -1) {
            pairs = request.url.substr(index + 1).split("&");
            for (var i = 0; i < pairs.length; i++) {
                var pos = pairs[i].indexOf('=');
                if (pos === -1)
                    continue;
                var key = pairs[i].substring(0, pos);
                var value = pairs[i].substring(pos + 1);
                // 中文解码,必须写两层
                value = decodeURIComponent(decodeURIComponent(value));
                args[key] = value;
            }
        }
    } else if ('POST' === request.method) {
        args = JSON.parse(request.post);
    }
    args.width = args.width || 1000;
    args.height = args.height || 400;
    return args;
};
另外涉及到的js(jquery-3.2.1.min.js echarts.min.js china.js) 请到https://gitee.com/saintlee/echartsconvert/tree/master 这里下载。
说明:echarts-util-one.js是重新改造的,之前是利用echartsconvert这个插件来生成图表的,但是echartsconvert这个插件不能生成饼图,所以就改造了echarts-util-one.js
三.环境配置说明
可以结合前面两篇看,首先安装phantomjs-2.1.1-windows,然后在其bin目录下,放入echarts-util-one.js以及相关lib包下的js(jquery-3.2.1.min.js echarts.min.js china.js),然后启动服务即可,命令如下:
D:\>cd D:\softpack\echarts\phantomjs-2.1.1-windows\bin

D:\softpack\echarts\phantomjs-2.1.1-windows\bin>phantomjs D:\softpack\echarts\phantomjs-2.1.1-windows\bin\echarts-util-one.js -s -p 6668
四.测试效果
环境配置完成之后,启动服务,swagger文档:http://localhost:8095/swagger-ui.html
测试数据:
(1)柱状图
{
"barParamList": {
"barName": [
"A罩杯", "B罩杯", "C罩杯", "D罩杯", "E罩杯", "F罩杯","G罩杯"
],
"barValue": [
43364, 13899, 12000, 2181, 21798, 1796, 1300
],
"legendName": "胸罩图例"
},
"horizontal": true,
"title": "胸罩使用人数"
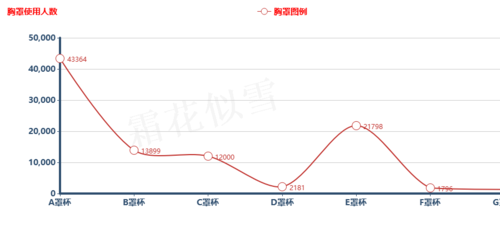
}(2)折线图
{
"horizontal": true,
"lineParam": {
"legendName": "胸罩图例",
"xdatas": [
[
43364, 13899, 12000, 2181, 21798, 1796, 1300
]
],
"ydatas": [
"A罩杯", "B罩杯", "C罩杯", "D罩杯", "E罩杯", "F罩杯","G罩杯"
]
},
"title": "胸罩使用人数"
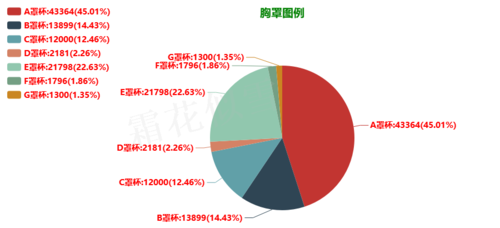
}(3)饼图
{
  "datas": [
    43364, 13899, 12000, 2181, 21798, 1796, 1300
  ],
  "title": "胸罩图例",
  "types": [
    "A罩杯", "B罩杯", "C罩杯", "D罩杯", "E罩杯", "F罩杯","G罩杯"
  ]
}
效果展示:
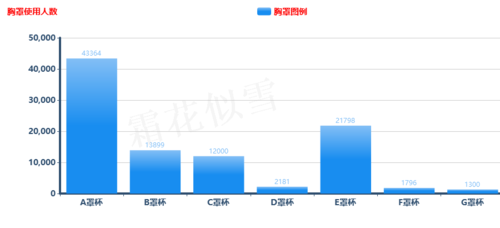
渐变色柱状图
分享就到这里,代码后续会开源出来,如果帮助到你了,请点个赞,感谢你的支持!如果你需要源代码,可以联系我!
在此,为你推荐几门优秀的课程:
(1)Java定时任务框架Elastic-Job和Quartz
(3)Tomcat+Memcached/Redis集群构建高可用解决方案
共同学习,写下你的评论
评论加载中...
作者其他优质文章