
ELK 基本概述
ELK是Elasticsearch、Logstash、Kibana的简称,常常用于部署分布式系统日志服务。
- Elasticsearch:全球实时全文搜索和分析引擎,提供搜集、分析、存储数据三大功能;是一套开放REST和JAVA API等结构提供高效搜索功能,可扩展的分布式系统。它构建于Apache Lucene搜索引擎库之上。
- Logstash:用来搜集、分析、过滤日志的工具。它支持几乎任何类型的日志,包括系统日志、错误日志和自定义应用程序日志。它可以从许多来源接收日志,这些来源包括 syslog、消息传递(例如 RabbitMQ)和JMX,它能够以多种方式输出数据,包括电子邮件、websockets和Elasticsearch。
- Kibana:基于Web的图形可视化界面,用于搜索、分析和可视化存储在 Elasticsearch指标中的日志数据。它利用Elasticsearch的REST接口来检索数据,不仅允许用户创建他们自己的数据的定制仪表板视图,还允许他们以特殊的方式查询和过滤数据。
基本架构图elk-architecture]:
应用程序将日志按照约定的Key写入Redis,Logstash从Redis中读取日志信息写入ElasticSearch集群。Kibana读取ElasticSearch中的日志,并在Web页面中以表格/图表的形式展示。
搭建部署ElasticSearch服务
Docker 部署应用服务的基本步骤:Search[查询镜像]->Pull[拉取镜像]->Run[部署镜像]
1.查询Elasticsearch 镜像: docker search elasticsearch
ps[注意事项]:
- 一般拉取镜像资源都是从Docker官方仓库[docker-hub]拉取,或者自己构建的Docker云仓库aliyun-docker 等
- 本教程选取的ELK镜像均是基于ELK官方Docker仓库elastic-io
2.拉取Elasticsearch 镜像:docker pull docker.elastic.co/elasticsearch/elasticsearch:7.3.1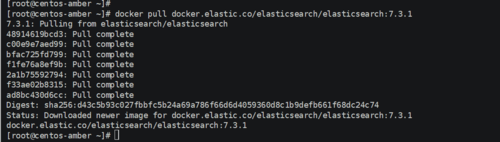
ps[注意事项]:
1.本教程采用7.3.x版本,目前最新版本7.4.x[主要用7.3.x版本在阿里云搭建过,避免入坑问题]
2.拉取的过程中可能会出现[net/http: TLS handshake timeout]问题,多尝试几次,主要是网络带宽限制问题
3.修改镜像名称:docker tag docker.elastic.co/elasticsearch/elasticsearch:7.3.1 elasticsearch:latest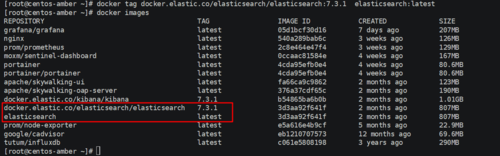
ps[注意事项]:
1.名称过长导致查看些许不便,通过docker tag source-image[来源镜像] target-image[目标镜像],推荐统一采用[target-image:target-version]格式定义,且不占用空间,相当于重命名镜像
2.对于拉取kibana[docker.elastic.co/kibana/kibana:7.3.1]和logstash[docker.elastic.co/logstash/logstash:7.3.1] 都建议修改。
4.部署镜像服务:
部署命令:
docker run -itd -p 9200:9200 -p 9300:9300 --restart=always --privileged=true --name elasticsearch-server -e “discovery.type=single-node” -e ES_JAVA_OPTS="-Xms=512m -Xms=512m" elasticsearch:latest
/usr/share/elasticsearch/config
/usr/share/elasticsearch/logs
查看容器列表:docker ps --format "table {{.ID}}\t{{.Names}}\t{{.Ports}}"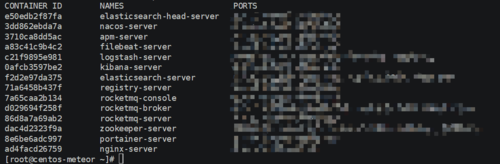
ps[注意事项]:
1.需要开放端口[9200和9300]->9200作为Http协议,主要用于外部通讯,9300作为Tcp协议,jar之间就是通过tcp协议通讯,通常部署集群就是通过9300通信。推荐[宿主机自定义端口:9200]
2.–restart=always :配置容器重启策略,当宿主机重启由于配置了开机自启动,不用手动启动
3.–privileged:配置容器操作权限[true-root操作权限,false-当前容器用户操作权限]
4.对于部署网络模式推荐默认桥接模式,也自定义可以host模式等
5.修改配置:
进入容器:docker exec -it container-id[容器id] or container-name[容器名称] /bin/bash
例如:docker exec -it f2d2e97da375 /bin/bash #f2d2e97da375-> container-id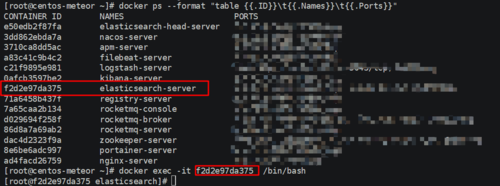
修改配置文件:
[root@f2d2e97da375 elasticsearch]# ls
LICENSE.txt  NOTICE.txt  README.textile  bin  config  data  jdk  lib  logs  modules  plugins
[root@f2d2e97da375 elasticsearch]#
[root@f2d2e97da375 elasticsearch]# cd config
[root@f2d2e97da375 config]# ls
elasticsearch.keystore  elasticsearch.yml  jvm.options  log4j2.properties  role_mapping.yml  roles.yml  users  users_roles
[root@f2d2e97da375 config]# vi elasticsearch.yml
添加跨域配置:http.cors.enabled: true && http.cors.allow-origin: "*"
cluster.name: "docker-cluster"
network.host: 0.0.0.0
http.cors.enabled: true
http.cors.allow-origin: "*"
然后退出exit容器,在宿主机重启容器:docker restart container-id[容器id] or container-name[容器名称]
docker restart f2d2e97da375
[root@f2d2e97da375 config]# exit
exit
[root@centos-meteor ~]# docker restart f2d2e97da375
f2d2e97da375
[root@centos-meteor ~]#
ps[注意事项]:
1.进入容器方式:包括使用 docker attach 命令或 docker exec 命令,
推荐使用 docker exec 命令。原因:
- docker attach: 使用exit退出容器,会导致容器的停止
- docker exec:使用exit退出容器,不会导致容器的停止
- 参考docker进入容器的几种方法博客-docker进入容器的几种方法
2.如果Docker安装了可视化界面 Portainer,推荐采用这种方式进入容器:
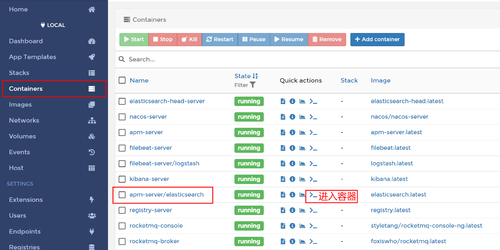
搭建部署ElasticSearch-Head服务
ElasticSearch-Head:弹性搜索集群的Web前端界面,是使用Nodjs构建的,主要用于查看ElasticSearch相关信息
1.拉取Elasticsearch-Head 镜像:docker pull mobz/elasticsearch-head:5
[root@centos-amber ~]# docker pull mobz/elasticsearch-head:5
5: Pulling from mobz/elasticsearch-head
75a822cd7888: Pull complete
57de64c72267: Pull complete
4306be1e8943: Pull complete
871436ab7225: Pull complete
0110c26a367a: Pull complete
1f04fe713f1b: Pull complete
723bac39028e: Pull complete
7d8cb47f1c60: Pull complete
7328dcf65c42: Pull complete
b451f2ccfb9a: Pull complete
304d5c28a4cf: Pull complete
4cf804850db1: Pull complete
Digest: sha256:55a3c82dd4ba776e304b09308411edd85de0dc9719f9d97a2f33baa320223f34
Status: Downloaded newer image for mobz/elasticsearch-head:5
docker.io/mobz/elasticsearch-head:5
[root@centos-amber ~]#
2.修改Elasticsearch-Head 镜像名称:docker tag mobz/elasticsearch-head:5 elasticsearch-head:latest
[root@centos-amber ~]# docker tag  mobz/elasticsearch-head:5        elasticsearch-head:latest
[root@centos-amber ~]# docker images
REPOSITORY                                      TAG                 IMAGE ID            CREATED             SIZE
grafana/grafana                                 latest              05d1bcf30d16        7 days ago          207MB
nginx                                           latest              540a289bab6c        3 weeks ago         126MB
prom/prometheus                                 latest              2c8e464e47f4        3 weeks ago         129MB
moxm/sentinel-dashboard                         latest              0ccaac81584e        4 weeks ago         167MB
portainer                                       latest              4cda95efb0e4        4 weeks ago         80.6MB
portainer/portainer                             latest              4cda95efb0e4        4 weeks ago         80.6MB
apache/skywalking-ui                            latest              fa66ca9c9862        2 months ago        123MB
apache/skywalking-oap-server                    latest              376a37cdf65c        2 months ago        190MB
docker.elastic.co/kibana/kibana                 7.3.1               b54865ba6b0b        2 months ago        1.01GB
docker.elastic.co/elasticsearch/elasticsearch   7.3.1               3d3aa92f641f        2 months ago        807MB
elasticsearch                                   latest              3d3aa92f641f        2 months ago        807MB
prom/node-exporter                              latest              e5a616e4b9cf        5 months ago        22.9MB
google/cadvisor                                 latest              eb1210707573        12 months ago       69.6MB
elasticsearch-head                              latest              b19a5c98e43b        2 years ago         824MB
mobz/elasticsearch-head                         5                   b19a5c98e43b        2 years ago         824MB
tutum/influxdb                                  latest              c061e5808198        3 years ago         290MB
[root@centos-amber ~]#
3.部署Elasticsearch-Head 容器:docker run -itd --restart=always --privileged=true -p 9100:9100 --name elasticsearch-head-server elasticsearch-head:latest
查看容器服务:docker ps --format "table {{.ID}}\t{{.Names}}\t{{.Ports}}"
4.浏览器访问:http://remote-ip:9100/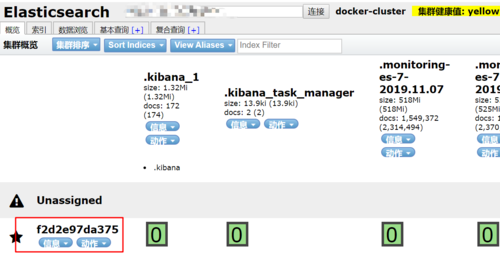
搭建部署Kibana服务
1.拉取Kibana 镜像:
docker pull docker.elastic.co/kibana/kibana:7.3.1
2.修改Kibana镜像名称:
docker tag docker.elastic.co/kibana/kibana:7.3.1 kibana:latest
3.部署Kibana镜像容器:
docker run -itd -p 5601:5601 --restart=always --privileged=true --link
elasticsearch-server:elasticsearch --name kibana-server -e ELASTICSEARCH_URL=http://elasticsearch:9200 kibana:latest
搭建部署Logstash服务
1.拉取Logstash 镜像:
docker pull docker.elastic.co/logstash/logstash:7.3.1
2.修改Kibana镜像名称:
docker tag docker.elastic.co/logstash/logstash:7.3.1 logstash:latest
3.部署Kibana镜像容器:
docker run -itd --restart=always --privileged=true -p 5043:5043 --name logstash-server --link elasticsearch-server:elasticsearch logstash:latest
4.进入容器-修改配置logstash.yml:
http.host: "0.0.0.0"
xpack.monitoring.elasticsearch.url: http://host-ip:9200
xpack.monitoring.elasticsearch.username: elastic
xpack.monitoring.elasticsearch.password: changme
ps[注意事项]:
1.host-ip是本机ip地址
5.进入容器-修改pipeline下的logstash.conf文件:
#默认配置
#========================================
#input {
#  beats {
#    port => 5044
#  }
#}

#output {
#  stdout {
#    codec => rubydebug
#  }
#}
#========================================
#添加配置
input {
        file {
            codec=> json
                path => "/usr/local/*.json"
        }
}
filter {
  #定义数据的格式
  grok {
    match => { "message" => "%{DATA:timestamp}\|%{IP:serverIp}\|%{IP:clientIp}\|%{DATA:logSource}\|%{DATA:userId}\|%{DATA:reqUrl}\|%{DATA:reqUri}\|%{DATA:refer}\|%{DATA:device}\|%{DATA:textDuring}\|%{DATA:duringTime:int}\|\|"}
  }
}
output {
   elasticsearch{
     hosts=> "http://host-ip:9200"
   }
}
6.退出容器在宿主机重启elk相关的容器:docker restart elk相关容器服务
ps[注意事项]:如果Docker安装了可视化界面 Portainer,可以在界面操作:
搭建部署Apm-server服务和Filebeat服务
步骤基本和上述操作差不多,只是配置文件和端口可能不一致:
拉取镜像:
docker pull docker.elastic.co/beats/filebeat:7.3.1
docker pull docker.elastic.co/apm/apm-server:7.3.1
修改镜像名称:
docker tag docker.elastic.co/beats/filebeat:7.3.1 filebeat:latest
docker tag docker.elastic.co/apm/apm-server:7.3.1 apm-server:latest
部署容器:
docker run -itd --restart=always --privileged=true -p 5044:5044 --name filebeat-server --link logstash-server:logstash filebeat:latest
docker run -itd --restart=always --privileged=true -p 8200:8200 --name apm-server --link elasticsearch-server:elasticsearch apm-server:latest --strict.perms=false -e -E output.elasticsearch.hosts=[“elasticsearch:9200”]
最后修改配置文件整合相关资源,重启容器服务
ps[注意事项]: 可以参考官方文档:
elasticsearch:https://www.elastic.co/guide/en/elasticsearch/reference/7.4/docker.html
kibana:https://www.elastic.co/guide/en/kibana/7.3/docker.html
logstash:https://www.elastic.co/guide/en/logstash/7.3/docker.html
filebeat:https://www.elastic.co/guide/en/beats/filebeat/7.3/running-on-docker.html
apm-server:https://www.elastic.co/guide/en/apm/server/7.3/running-on-docker.html
开发SpringBoot+Elasticsearch集成实战
[1] 集成Maven配置方式:
Java与ElasticSearch连接的两种方式:
(1)使用Transport与ElasticSearch建立连接
<!-- https://mvnrepository.com/artifact/org.elasticsearch/elasticsearch -->
<dependency>
       <groupId>org.elasticsearch</groupId>
       <artifactId>elasticsearch</artifactId>
       <version>6.4.2</version>
 </dependency>
   <!-- https://mvnrepository.com/artifact/org.elasticsearch.client/transport -->      <dependency>
   <groupId>org.elasticsearch.client</groupId>
   <artifactId>transport</artifactId>
   <version>6.4.2</version>
   <exclusions>
       <exclusion>
       <groupId>org.elasticsearch</groupId>
       <artifactId>elasticsearch</artifactId>
       </exclusion>
   </exclusions>
 </dependency>
(2)使用SpringDataElasticSearch建立连接
<dependency>
<groupId>org.springframework.boot</groupId>
<artifactId>spring-boot-starter-data-elasticsearch</artifactId>
</dependency>
或者:
dependencies {
    compile('org.springframework.boot:spring-boot-starter')
    // 使用SpringDataElasticSearch只需要添加一处依赖即用
    compile('org.springframework.boot:spring-boot-starter-data-elasticsearch')
}
两种方式的优缺点:
(1)优点:脱离框架,集成过程中不需要考虑与Spring的版本兼容问题,容易集成
缺点:使用原生API操作ES,代码量大,撰写困难
(2)优点:将原生API进行封装,提供了ElasticsearchRepository,操作ES非常简单,与JPA同理
缺点:出生于Spring家族,与SpringBoot,SpringData版本容易冲突
[2] 参数连接配置方式:
# Elasticsearch# 9200端口是用来让HTTP REST API来访问ElasticSearch,而9300端口是传输层监听的默认端口
elasticsearch.ip=192.168.30.128
elasticsearch.port=9300
elasticsearch.pool=5
elasticsearch.cluster.name=my-application
node.name: "elasticsearch-server"
network.host: 0.0.0.0
network.bind_host: 0.0.0.0
network.publish_host: 0.0.0.0
http.cors.enabled: true
http.cors.allow-origin: "*"
bootstrap.memory_lock: true
transport.tcp.port: 9300
transport.tcp.compress: true
http.max_content_length: 128mb
版权声明:本文为博主原创文章,遵循相关版权协议,如若转载或者分享请附上原文出处链接和链接来源。
共同学习,写下你的评论
评论加载中...
作者其他优质文章


