
课程名称:Vue + EChart 4.0 从0到1打造商业级数据报表项目
课程章节:重构销售趋势图和列表开发,新增关键词开发
课程讲师: Sam
课程内容:
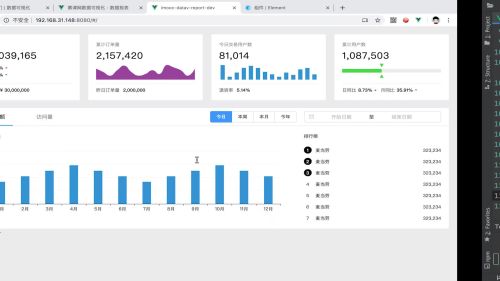
重构销售趋势图和列表开发
利用动态v-bing动态对前三名进行排行显示,:class="[‘list-item-no’, +item.no <= 3 ? ‘top-no’ : ‘’]",之前使用的都是选中单独设置,
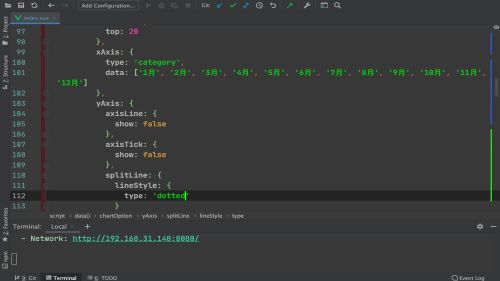
设置 yAxis样式 ,y轴水平线
axisLine axisTick 是将竖线去掉 alignWidthLable:true(默认是false) 柱状图跟跟虚线对齐
splitLine是将y轴所有的水平线改为虚线
<template>
  <div class="sales-view">
    <el-card shadow="hover" :body-style="{ padding: '0 0 20px 0' }">
      <template v-slot:header>
        <div class="menu-wrapper">
          <el-menu
            :default-active="activeIndex"
            mode="horizontal"
            @select="onMenuSelect"
            class="sales-view-menu"
          >
            <el-menu-item index="1">销售额</el-menu-item>
            <el-menu-item index="2">访问量</el-menu-item>
          </el-menu>
          <div class="menu-right">
            <el-radio-group v-model="radioSelect" size="small">
              <el-radio-button label="今日" />
              <el-radio-button label="本周" />
              <el-radio-button label="本月" />
              <el-radio-button label="今年" />
            </el-radio-group>
            <el-date-picker
              type="daterange"
              v-model="date"
              range-separator="至"
              start-placeholder="开始日期"
              end-placeholder="结束日期"
              size="small"
              unlink-panels
              :picker-options="pickerOptions"
              class="sales-view-date-picker"
            />
          </div>
        </div>
      </template>
      <template>
        <div class="sales-view-chart-wrapper">
          <v-chart :options="chartOption" />
          <div class="sales-view-list">
            <div class="sales-view-title">排行榜</div>
            <div class="list-item-wrapper">
              <div class="list-item" v-for="item in rankData" :key="item.no">
                <div :class="['list-item-no', +item.no <= 3 ? 'top-no' : '']">{{item.no}}</div>
                <div class="list-item-name">{{item.name}}</div>
                <div class="list-item-money">{{item.money}}</div>
              </div>
            </div>
          </div>
        </div>
      </template>
    </el-card>
  </div>
</template>

<script>
  import commonDataMixin from '../../mixins/commonDataMixin'

  export default {
    mixins: [commonDataMixin],
    data() {
      return {
        activeIndex: '1',
        radioSelect: '今日',
        date: null,
        pickerOptions: {
          shortcuts: [{
            text: '最近一周',
            onClick(picker) {
              const start = new Date()
              const end = new Date()
              start.setTime(start.getTime() - 3600 * 24 * 1000 * 7)
              picker.$emit('pick', [start, end])
            }
          }, {
            text: '最近一个月',
            onClick(picker) {
              const start = new Date()
              const end = new Date()
              start.setTime(start.getTime() - 3600 * 24 * 1000 * 30)
              picker.$emit('pick', [start, end])
            }
          }, {
            text: '最近三个月',
            onClick(picker) {
              const start = new Date()
              const end = new Date()
              start.setTime(start.getTime() - 3600 * 24 * 1000 * 90)
              picker.$emit('pick', [start, end])
            }
          }]
        },
        chartOption: {}
      }
    },
    computed: {
      rankData() {
        return this.activeIndex === '1' ? this.orderRank : this.userRank
      }
    },
    watch: {
      orderFullYear() {
        this.render(this.orderFullYear, this.orderFullYearAxis, '年度销售额')
      }
    },
    methods: {
      onMenuSelect(index) {
        this.activeIndex = index
        if (index === '1') {
          this.render(this.orderFullYear, this.orderFullYearAxis, '年度销售额')
        } else {
          this.render(this.userFullYear, this.userFullYearAxis, '年度用户访问量')
        }
      },
      render(data, axis, title) {
        this.chartOption = {
          title: {
            text: title,
            textStyle: {
              fontSize: 12,
              color: '#666'
            },
            left: 25,
            top: 20
          },
          xAxis: {
            type: 'category',
            data: axis,
            axisTick: {
              alignWithLabel: true,
              lineStyle: {
                color: '#999'
              }
            },
            axisLine: {
              lineStyle: {
                color: '#999'
              }
            },
            axisLabel: {
              color: '#333'
            }
          },
          yAxis: {
            axisLine: {
              show: false
            },
            axisTick: {
              show: false
            },
            splitLine: {
              lineStyle: {
                type: 'dotted',
                color: '#eee'
              }
            }
          },
          series: [{
            type: 'bar',
            barWidth: '35%',
            data
          }],
          color: ['#3398DB'],
          grid: {
            top: 70,
            left: 60,
            right: 60,
            bottom: 50
          }
        }
      }
    }
  }
</script>

<style lang="scss" scoped>
  .sales-view {
    margin-top: 20px;

    .menu-wrapper {
      position: relative;
      display: flex;

      .sales-view-menu {
        width: 100%;
        padding-left: 20px;

        .el-menu-item {
          height: 50px;
          line-height: 50px;
          margin: 0 20px;
        }
      }

      .menu-right {
        position: absolute;
        top: 0;
        right: 20px;
        height: 50px;
        display: flex;
        align-items: center;
        justify-content: flex-end;

        .sales-view-date-picker {
          margin-left: 20px;
        }
      }
    }

    .sales-view-chart-wrapper {
      display: flex;
      height: 270px;

      .echarts {
        flex: 0 0 70%;
        width: 70%;
        height: 100%;
      }

      .sales-view-list {
        flex: 1;
        width: 100%;
        height: 100%;
        overflow: hidden;

        .sales-view-title {
          margin-top: 20px;
          font-size: 12px;
          color: #666;
          font-weight: 500;
        }

        .list-item-wrapper {
          margin-top: 15px;

          .list-item {
            display: flex;
            align-items: center;
            font-size: 12px;
            height: 20px;
            padding: 6px 20px 6px 0;

            .list-item-no {
              display: flex;
              align-items: center;
              justify-content: center;
              width: 20px;
              height: 20px;
              color: #333;

              &.top-no {
                background: #000;
                border-radius: 50%;
                color: #fff;
                font-weight: 500;
              }
            }

            .list-item-name {
              margin-left: 10px;
              color: #333;
            }

            .list-item-money {
              flex: 1;
              text-align: right;
            }
          }
        }
      }
    }
  }
</style>
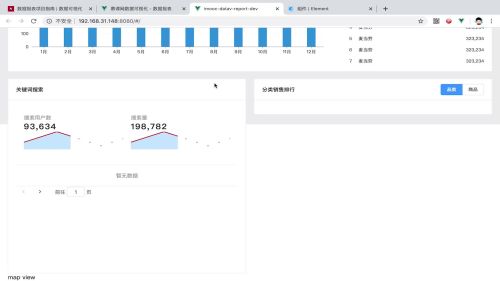
关键词开发
<template>
  <div class="bottom-view">
    <div class="view">
      <el-card shadow="hover">
        <template v-slot:header>
          <div class="title-wrapper">关键词搜索</div>
        </template>
        <template>
          <div class="chart-wrapper">
            <div class="chart-inner">
              <div class="chart">
                <div class="chart-title">搜索用户数</div>
                <div class="chart-data">{{userCount | format}}</div>
                <v-chart :options="searchUserOption" />
              </div>
              <div class="chart">
                <div class="chart-title">搜索量</div>
                <div class="chart-data">{{searchCount | format}}</div>
                <v-chart :options="searchNumberOption" />
              </div>
            </div>
            <div class="table-wrapper">
              <el-table :data="tableData">
                <el-table-column prop="rank" label="排名" />
                <el-table-column prop="keyword" label="关键词" />
                <el-table-column prop="count" label="总搜索量" />
                <el-table-column prop="users" label="搜索用户数" />
                <el-table-column prop="range" label="搜索占比" />
              </el-table>
              <el-pagination
                layout="prev, pager, next"
                :total="total"
                :page-size="pageSize"
                background
                @current-change="onPageChange"
              />
            </div>
          </div>
        </template>
      </el-card>
    </div>
    <div class="view">
      <el-card shadow="hover">
        <template v-slot:header>
          <div class="title-wrapper">
            <div class="title">分类销售排行</div>
            <div class="radio-wrapper">
              <el-radio-group v-model="radioSelect" size="small" @change="onCategoryChange">
                <el-radio-button label="品类"></el-radio-button>
                <el-radio-button label="商品"></el-radio-button>
              </el-radio-group>
            </div>
          </div>
        </template>
        <template>
          <div class="chart-wrapper">
            <v-chart :options="categoryOptions" />
          </div>
        </template>
      </el-card>
    </div>
  </div>
</template>

<script>
  import commonDataMixin from '../../mixins/commonDataMixin'

  const colors = ['#8d7fec', '#5085f2', '#f8726b', '#e7e702', '#78f283', '#4bc1fc']

  export default {
    mixins: [commonDataMixin],
    data() {
      return {
        searchUserOption: {},
        searchNumberOption: {},
        tableData: [],
        totalData: [],
        total: 0,
        pageSize: 4,
        userCount: 0,
        searchCount: 0,
        radioSelect: '品类',
        categoryOptions: {}
      }
    },
    methods: {
      onCategoryChange(type) {
        this.radioSelect = type
        this.renderPieChart()
      },
      onPageChange(page) {
        this.renderTable(page)
      },
      renderPieChart() {
        if (!this.category1.data1 || !this.category2.data1) {
          return
        }
        let data
        let axis
        let total = 0
        if (this.radioSelect === '品类') {
          data = this.category1.data1.slice(0, 6)
          axis = this.category1.axisX.slice(0, 6)
          total = data.reduce((s, i) => s + i, 0)
        } else {
          data = this.category2.data1.slice(0, 6)
          axis = this.category2.axisX.slice(0, 6)
          total = data.reduce((s, i) => s + i, 0)
        }
        const chartData = []
        data.forEach((item, index) => {
          const percent = `${(item / total * 100).toFixed(2)}%`
          chartData.push({
            legendname: axis[index],
            value: item,
            percent,
            itemStyle: {
              color: colors[index]
            },
            name: `${axis[index]} | ${percent}`
          })
        })
        this.categoryOptions = {
          title: [{
            text: `${this.radioSelect}分布`,
            textStyle: {
              fontSize: 14,
              color: '#666'
            },
            left: 20,
            top: 20
          }, {
            text: '累计订单量',
            subtext: total,
            x: '34.5%',
            y: '42.5%',
            textStyle: {
              fontSize: 14,
              color: '#999'
            },
            subtextStyle: {
              fontSize: 28,
              color: '#333'
            },
            textAlign: 'center'
          }],
          series: [{
            name: '品类分布',
            type: 'pie',
            data: chartData,
            label: {
              normal: {
                show: true,
                position: 'outter',
                formatter: function (params) {
                  return params.data.legendname
                }
              }
            },
            center: ['35%', '50%'],
            radius: ['45%', '60%'],
            labelLine: {
              normal: {
                length: 5,
                length2: 3,
                smooth: true
              }
            },
            clockwise: false,
            itemStyle: {
              borderWidth: 4,
              borderColor: '#fff'
            }
          }],
          legend: {
            type: 'scroll',
            orient: 'vertical',
            height: 250,
            left: '70%',
            top: 'middle',
            textStyle: {
              color: '#8c8c8c'
            }
          },
          tooltip: {
            trigger: 'item',
            formatter: function (params) {
              const str = params.seriesName + '<br />' +
                params.marker + params.data.legendname + '<br />' +
                '数量:' + params.data.value + '<br />' +
                '占比:' + params.data.percent + '%'
              return str
            }
          }
        }
      },
      renderTable(page) {
        this.tableData = this.totalData.slice(
          (page - 1) * this.pageSize,
          (page - 1) * this.pageSize + this.pageSize
        )
      },
      renderLineChart() {
        const createOption = (key) => {
          const data = []
          const axis = []
          this.wordCloud.forEach(item => data.push(item[key]))
          this.wordCloud.forEach(item => axis.push(item.word))
          return {
            xAxis: {
              type: 'category',
              boundaryGap: false,
              data: axis
            },
            yAxis: {
              show: false
            },
            tooltip: {},
            series: [{
              type: 'line',
              data,
              areaStyle: {
                color: 'rgba(95,187,255,.5)'
              },
              lineStyle: {
                color: 'rgb(95,187,255)'
              },
              itemStyle: {
                opacity: 0
              },
              smooth: true
            }],
            grid: {
              top: 0,
              left: 0,
              bottom: 0,
              right: 0
            }
          }
        }
        this.searchUserOption = createOption('user')
        this.searchNumberOption = createOption('count')
      }
    },
    mounted() {
      this.renderPieChart()
    },
    watch: {
      wordCloud() {
        const totalData = []
        this.wordCloud.forEach((item, index) => {
          totalData.push({
            id: index + 1,
            rank: index + 1,
            keyword: item.word,
            count: item.count,
            users: item.user,
            range: `${((item.user / item.count) * 100).toFixed(2)}%`
          })
        })
        this.totalData = totalData
        this.total = this.totalData.length
        this.renderTable(1)
        this.userCount = totalData.reduce((s, i) => i.users + s, 0)
        this.searchCount = totalData.reduce((s, i) => i.count + s, 0)
        this.renderLineChart()
      },
      category1() {
        this.renderPieChart()
      }
    }
  }
</script>

<style lang="scss" scoped>
  .bottom-view {
    display: flex;
    margin-top: 20px;

    .view {
      flex: 1;
      width: 50%;
      box-sizing: border-box;

      &:first-child {
        padding: 0 10px 0 0;
      }

      &:last-child {
        padding: 0 0 0 10px;
      }

      .title-wrapper {
        display: flex;
        align-items: center;
        height: 60px;
        box-sizing: border-box;
        border-bottom: 1px solid #eee;
        font-size: 14px;
        font-weight: 500;
        padding: 0 0 0 20px;

        .radio-wrapper {
          flex: 1;
          display: flex;
          justify-content: flex-end;
          padding-right: 20px;
        }
      }

      .chart-wrapper {
        display: flex;
        flex-direction: column;
        height: 452px;

        .chart-inner {
          display: flex;
          padding: 0 10px;
          margin-top: 20px;

          .chart {
            flex: 1;
            padding: 0 10px;

            .chart-title {
              color: #999;
              font-size: 14px;
            }

            .chart-data {
              font-size: 22px;
              color: #333;
              font-weight: 500;
              letter-spacing: 2px;
            }

            .echarts {
              height: 50px;
            }
          }
        }

        .table-wrapper {
          flex: 1;
          margin-top: 20px;
          padding: 0 20px 20px;

          .el-pagination {
            display: flex;
            justify-content: flex-end;
            margin-top: 15px;
          }
        }
      }
    }
  }
</style>
type:Line 折线图
areaStyle :区域颜色
lineStyle :线的颜色
itemStyle:不在折线图显示文字
smooth:true 光滑的曲线
课程收获:
学习到了新的利用动态v-bing动态特殊进行排行显示,利用 alignWidthLable:true(默认是false) 柱状图跟跟虚线对齐,怎么使用el-table添加表格数据,再利用子选项el-table-column设置自己的子选项,prop定义关键字,lable来定义表头
点击查看更多内容
1人点赞
评论
共同学习,写下你的评论
评论加载中...
作者其他优质文章
正在加载中


感谢您的支持,我会继续努力的~
扫码打赏,你说多少就多少
赞赏金额会直接到老师账户
支付方式
打开微信扫一扫,即可进行扫码打赏哦