地图投影
对于接触互联网地图的同学来说,最开始接触的恐怕就是坐标转换的过程了。由于地球是个近似椭球的形状,有各种各样的椭球模型来模拟地球,最著名的也就是GPS系统使用的WGS84椭球了。但是这些椭球体的坐标使用的是经纬度,单位是角度。目前我们的地图大多是二维平面上展示,使用角度为基础来计算多有不便,所以有众多数学家提出各种不同的转换方式来将经纬度表示的位置转换成平面坐标,这个转换过程地图学上成为投影。投影的方式多种多样,对我们做互联网地图的来说,最重要的就是墨卡托投影的变体——Web墨卡托投影。我们先来看一下墨卡托投影的转换过程
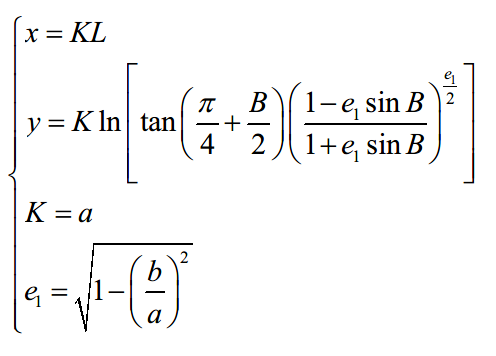
(以赤道本初子午线为原点)
投影完毕后的结果就是:
先不要头疼数学公式,已经有很多类库做好了代码实现,比如leaflet:

L.Projection.Mercator = {
    R: 6378137,
    R_MINOR: 6356752.314245179,

    bounds: L.bounds([-20037508.34279, -15496570.73972], [20037508.34279, 18764656.23138]),

    project: function (latlng) {        var d = Math.PI / 180,
            r = this.R,
            y = latlng.lat * d,
            tmp = this.R_MINOR / r,
            e = Math.sqrt(1 - tmp * tmp),
            con = e * Math.sin(y);        var ts = Math.tan(Math.PI / 4 - y / 2) / Math.pow((1 - con) / (1 + con), e / 2);
        y = -r * Math.log(Math.max(ts, 1E-10));        return new L.Point(latlng.lng * d * r, y);
    },

    unproject: function (point) {        var d = 180 / Math.PI,
            r = this.R,
            tmp = this.R_MINOR / r,
            e = Math.sqrt(1 - tmp * tmp),
            ts = Math.exp(-point.y / r),
            phi = Math.PI / 2 - 2 * Math.atan(ts);        for (var i = 0, dphi = 0.1, con; i < 15 && Math.abs(dphi) > 1e-7; i++) {
            con = e * Math.sin(phi);
            con = Math.pow((1 - con) / (1 + con), e / 2);
            dphi = Math.PI / 2 - 2 * Math.atan(ts * con) - phi;
            phi += dphi;
        }        return new L.LatLng(phi * d, point.x * d / r);
    }
};
接下来我们说一下互联网地图真正使用的投影——Web墨卡托或者也叫球形墨卡托。一般来说按照传统地图学的要求,一个投影坐标系都要有一个对应的椭球体,比如从WGS84的坐标转换成国内腾讯地图或者百度地图的坐标,都是要经过一步椭球体转换成gcj02椭球下的经纬度然后才能打点。所以有没有小伙伴在开发中使用Geolocation接口获取的经纬度直接传入上面地图api中打点发现误差很大?就是因为没有转成gcj02椭球下的经纬度。但是web墨卡托这个投影其实并不符合地图学的要求,它没有对应的椭球体,它是谷歌自己造出来的(因为简单),也可以说对任何椭球体都适用,但这种时候我们在表达一个位置信息时严格来说应当这样表达:***椭球下的Web墨卡托投影坐标是***。
好了现在来说一下web墨卡托的转换方式:
/*
 * @namespace Projection
 * @projection L.Projection.SphericalMercator
 *
 * Spherical Mercator projection — the most common projection for online maps,
 * used by almost all free and commercial tile providers. Assumes that Earth is
 * a sphere. Used by the `EPSG:3857` CRS. */L.Projection.SphericalMercator = {

    R: 6378137,
    MAX_LATITUDE: 85.0511287798,

    project: function (latlng) {        var d = Math.PI / 180,
            max = this.MAX_LATITUDE,
            lat = Math.max(Math.min(max, latlng.lat), -max),
            sin = Math.sin(lat * d);        return new L.Point(                this.R * latlng.lng * d,                this.R * Math.log((1 + sin) / (1 - sin)) / 2);
    },

    unproject: function (point) {        var d = 180 / Math.PI;        return new L.LatLng(
            (2 * Math.atan(Math.exp(point.y / this.R)) - (Math.PI / 2)) * d,
            point.x * d / this.R);
    },

    bounds: (function () {        var d = 6378137 * Math.PI;        return L.bounds([-d, -d], [d, d]);
    })()
};
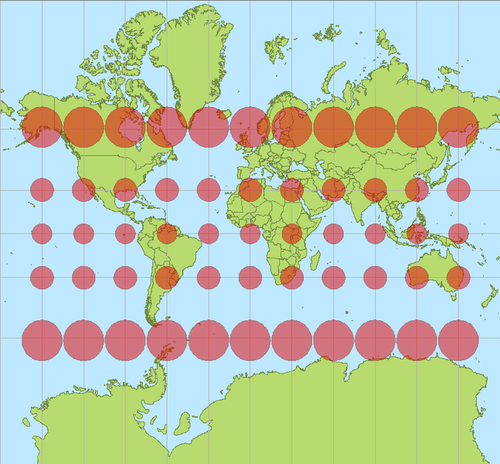
相对来说这个计算方法简单一些,但是这种投影有一些缺点,比如维度投影范围只能在-85~85之间,一般来说没什么关系,反正一般人不会闲的没事跑南北极去。同时由于南北极特殊的位置,通常有一些专门的地图来表达。
地图的组织方式
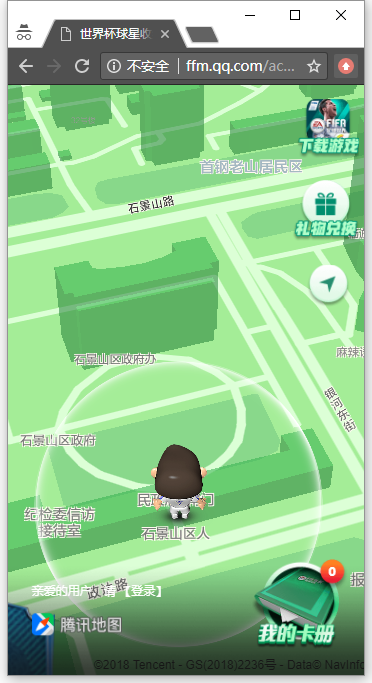
可以观察一下腾讯地图在展示时,通常是一个正方形一个正方形的出现,这些正方形地图上成为瓦片。下面我们来说一下地图的组织方式。
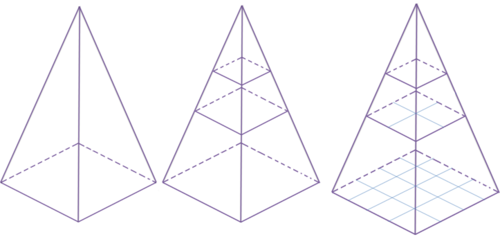
如果地图数据有一个G,那么在端上展示地图时,是把整个地图数据全部下载下来好还是只把我们需要看的一部分下来好呢。答案肯定是后者。那么有来一个问题,是每次都根据位置实时计算好还是提前将地图分割成块,根据范围加载瓦片好呢?这个问题的答案不完全是瓦片,但绝大多数都是。所以现在互联网地图的组织形式就是金字塔结构的瓦片地图。
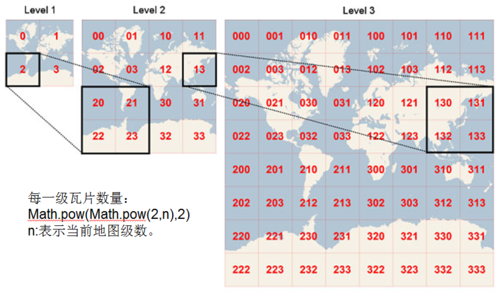
瓦片地图金字塔模型是一种多分辨率层次模型,从瓦片金字塔的底层到顶层,分辨率越来越低,但表示的地理范围不变(这张图瓦片坐标是从左上角开始,通常谷歌系标准的瓦片是从左下角起始的)。
那么这些瓦片的级别是按照什么规则来分的呢?这就要牵扯出地图学中另一个重要的概念——比例尺(即地图上的一厘米代表着实际上的多少厘米)。到了web地图中我们把比例尺转换成另一个概念——分辨率(Resolution,图上一像素代表实际多少米)。比例尺跟分辨率的换算举个例子:
//示例来自:http://www.cnblogs.com/naaoveGIS/
//这里的像素是设备像素
现在假设地图的坐标单位是米,dpi为96 ;
    1英寸=2.54厘米;
    1英寸=96像素;
    最终换算的单位是米;
    如果当前地图比例尺为1:125000000,则代表图上1米等于实地125000000米;
    米和像素间的换算公式:
    1英寸=0.0254米=96像素
    1像素=0.0254/96 米
    则根据1:125000000比例尺,图上1像素代表实地距离是 125000000*0.0254/96 = 33072.9166666667米。
上面这个例子同样可以由分辨率换算出比例尺。所以在互联网地图中我们先不去关心比例尺,只关心分辨率的概念,假设瓦片的大小为256像素,每一级别的瓦块数目为2^n * 2^n。分辨率计算公式为:
r=6378137resolution=2*PI*r/(2^zoom*256)
r为Web墨卡托投影时选取的地球半径,2*PI*r代表地球周长,地球周长除以该级别下所有瓦片像素得到分辨率。
注意这里的像素实际并不是设备像素,而是一种参照像素(web中的css像素或者是安卓上的设备无关像素),比如在某些高清屏下(window.devicePixelRatio = 3),一参照像素宽度等于3设备像素,这时候可能实际瓦片大小是512设备像素的,但是在显示时仍然要把它显示成256参照像素(css像素)。
从经纬度到地图瓦片
现在要进入关键的一步!如何给定经纬度来找出对应瓦片。这时候又要经过几个坐标转换的过程:
经纬度转Web墨卡托;
Web墨卡托转世界平面点;
世界平面点转瓦片像素坐标;
瓦片像素坐标转瓦片行列号
我们再来看一下这些瓦片的组织方式,

可以看到这里的起始点是从左上角开始的,而经纬度和Web墨卡托的起始点是赤道和本初子午线,在瓦片像素坐标的中心它的坐标是(256 * 2^n / 2, 256 * 2^n / 2),所以中间就有了世界平面点这一步,它是一个中间转换的过程。
所以上文中我们给出了经纬度转Web墨卡托的代码。那么接下来就要把Web墨卡托坐标转换成为世界平面点,这个坐标系的原点在左上角(0, 0),在leaft中它认为这个坐标的原点在左上角为(0,0),坐标范围为0~1。对应代码:
// @method latLngToPoint(latlng: LatLng, zoom: Number): Point
    // Projects geographical coordinates into pixel coordinates for a given zoom.
    latLngToPoint: function (latlng, zoom) {        var projectedPoint = this.projection.project(latlng),
            scale = this.scale(zoom);        return this.transformation._transform(projectedPoint, scale);
    },// @method scale(zoom: Number): Number
    // Returns the scale used when transforming projected coordinates into
    // pixel coordinates for a particular zoom. For example, it returns
    // `256 * 2^zoom` for Mercator-based CRS.
    scale: function (zoom) {        return 256 * Math.pow(2, zoom);
    },
transform对应的代码为:
/*
 * @class Transformation
 * @aka L.Transformation
 *
 * Represents an affine transformation: a set of coefficients `a`, `b`, `c`, `d`
 * for transforming a point of a form `(x, y)` into `(a*x + b, c*y + d)` and doing
 * the reverse. Used by Leaflet in its projections code.
 *
 * @example
 *
 * ```js
 * var transformation = new L.Transformation(2, 5, -1, 10),
 *     p = L.point(1, 2),
 *     p2 = transformation.transform(p), //  L.point(7, 8)
 *     p3 = transformation.untransform(p2); //  L.point(1, 2)
 * ``` */// factory new L.Transformation(a: Number, b: Number, c: Number, d: Number)// Creates a `Transformation` object with the given coefficients.L.Transformation = function (a, b, c, d) {    this._a = a;    this._b = b;    this._c = c;    this._d = d;
};

L.Transformation.prototype = {    // @method transform(point: Point, scale?: Number): Point
    // Returns a transformed point, optionally multiplied by the given scale.
    // Only accepts actual `L.Point` instances, not arrays.
    transform: function (point, scale) { // (Point, Number) -> Point
        return this._transform(point.clone(), scale);
    },    // destructive transform (faster)
    _transform: function (point, scale) {
        scale = scale || 1;
        point.x = scale * (this._a * point.x + this._b);
        point.y = scale * (this._c * point.y + this._d);        return point;
    },    // @method untransform(point: Point, scale?: Number): Point
    // Returns the reverse transformation of the given point, optionally divided
    // by the given scale. Only accepts actual `L.Point` instances, not arrays.
    untransform: function (point, scale) {
        scale = scale || 1;        return new L.Point(
                (point.x / scale - this._b) / this._a,
                (point.y / scale - this._d) / this._c);
    }
};
对于Web墨卡托来说,transformation的四个参数为:
/*
 * @namespace CRS
 * @crs L.CRS.EPSG3857
 *
 * The most common CRS for online maps, used by almost all free and commercial
 * tile providers. Uses Spherical Mercator projection. Set in by default in
 * Map's `crs` option. */L.CRS.EPSG3857 = L.extend({}, L.CRS.Earth, {
    code: 'EPSG:3857',
    projection: L.Projection.SphericalMercator,

    transformation: (function () {        var scale = 0.5 / (Math.PI * L.Projection.SphericalMercator.R);        return new L.Transformation(scale, 0.5, -scale, 0.5);
    }())
});

L.CRS.EPSG900913 = L.extend({}, L.CRS.EPSG3857, {
    code: 'EPSG:900913'});
这里要解释一下在Web墨卡托中transform这四个参数的意思:scale代表球的周长分之一,b和d都是0.5这代表赤道和本初子午线的交点在世界平面点的位置为(0.5, 0.5);`this._a * point.x + this._b`代表x轴方向墨卡托坐标在世界平面点位置,c=-scale,结合 this._c * point.y + this._d,能计算出y轴方向墨卡托在世界平面点位置。至于c为什么是付的,结合一下维度坐标的性质,以上为正下为负,到了世界平面坐标中,负的纬度坐标要大于0.5。
接下来的两步就比较简单了,世界平面点坐标转像素坐标,只要乘以各个轴上对应的像素长度:
256 * 2^zoom * coord.x256 * 2^zoom * coord.y
在leaft中其实已经在Transformation的_transform函数中坐了这一步。
剩下的我们已经知道了像素坐标,就很容易求出对应的瓦片:
//tileSize = 256xIndex = pixelCoord.x / tileSize;
yIndex = pixelCoord.y / tileSize;
注意谷歌系的瓦片都是以左下角为瓦片索引的起始,所以对应的y方向上的瓦片计算方式为:
Math.pow(2, mapZoom) - yIndex - 1
加载一屏地图
一般来说在实例化一个地图时,都会给给Map构造函数传入一个zoom和一个center参数,3d情况下还会传入theta和phi代表左右旋转和上下翻转,然后就会加载出一幅地图。为了简单起见我们先说说2D情况,以leaflet为例
要加载一幅地图,我们只需要知道屏幕四个点的经纬度所在范围内的瓦片,再将这些瓦片按照一定的偏移坐标布置即可。
上面传入的center代表当前范围的中心点,同时也是屏幕的中心点,那么就可以求出该经纬度对应的像素坐标,这个像素坐标就是屏幕中心点对应的瓦片像素坐标。这里的像素与我们的css像素一一对应,利用屏幕范围可得出屏幕四个角点的瓦片像素坐标。利用这四个点的瓦片坐标,可以求出当前屏幕的瓦片索引范围,加载这些瓦片。
    _getTiledPixelBounds: function (center) {        var map = this._map,
            mapZoom = map._animatingZoom ? Math.max(map._animateToZoom, map.getZoom()) : map.getZoom(),
            scale = map.getZoomScale(mapZoom, this._tileZoom),
            pixelCenter = map.project(center, this._tileZoom).floor(),
            halfSize = map.getSize().divideBy(scale * 2);        return new L.Bounds(pixelCenter.subtract(halfSize), pixelCenter.add(halfSize));
    },
    _pxBoundsToTileRange: function (bounds) {        var tileSize = this.getTileSize();        return new L.Bounds(
            bounds.min.unscaleBy(tileSize).floor(),
            bounds.max.unscaleBy(tileSize).ceil().subtract([1, 1]));
    },
接下来要注意一些,这时候这些瓦片的坐标范围肯定是大于屏幕的坐标范围,所以要对所有的瓦片做一些偏移。计算过程比较简单,屏幕坐标以左上点为原点,这个点对应的像素坐标已知,只要求出每个瓦片的左上角点的瓦片像素坐标与屏幕左上点的瓦片像素坐标做差值,即可得出在css中的position的偏移值(高级点的用css3的translate)。下面我们可以看看leaflet的处理过程:
_setView: function (center, zoom, noPrune, noUpdate) {        var tileZoom = Math.round(zoom);        if ((this.options.maxZoom !== undefined && tileZoom > this.options.maxZoom) ||
            (this.options.minZoom !== undefined && tileZoom < this.options.minZoom)) {
            tileZoom = undefined;
        }        var tileZoomChanged = this.options.updateWhenZooming && (tileZoom !== this._tileZoom);        if (!noUpdate || tileZoomChanged) {            this._tileZoom = tileZoom;            if (this._abortLoading) { // 如果zoom要发生变化,停止当前所有tiles的加载;通过更改他们的onload onerror事件实现
                this._abortLoading();
            }            // 1、创建该级别容器瓦片
            // 2、 设置zIndex
            // 3、设置本级别图层基准点origin
            // 4、设置值本级别容器的偏移量
            this._updateLevels();            // 1、得到世界的像素bounds
            // 2、得通过像素范围除以tileSize得到能够覆盖世界的瓦片范围
            // 3、得到坐标系经度和纬度范围内的瓦片范围
            this._resetGrid();            if (tileZoom !== undefined) {                // 加载可视范围内的瓦片
                // 1、计算可视区域的像素范围
                // 2、 将像素范围转变成瓦片格网范围
                // 3、计算一个buffer的格网范围
                // 4、将不再当前范围内已加载的瓦片打上标签
                // 5、如果zoom发生变化重新进行setView
                // 6、将格网范围内的tile放入一个数组中
                // 7、对数组进行排序,靠近中心点的先加载
                // 8、创建瓦片
                //     (1) 计算瓦片在地图上的偏移量 coords * tileSize - origin
                //     (2) 加载瓦片数据(图片或者矢量数据)
                //  (3) 设置图片位置 setPosition
                this._update(center);
            }            if (!noPrune) {                this._pruneTiles(); // 移除不在范围内的tile; retainParent部分尚没看懂,可能是按照瓦片金字塔保留            }            // Flag to prevent _updateOpacity from pruning tiles during
            // a zoom anim or a pinch gesture
            this._noPrune = !!noPrune;
        }//将地图的新中心点移到地图中央
        this._setZoomTransforms(center, zoom);
    },
3D地图的加载
互联网地图发展到现在出现了不少3D地图,3D的计算过程有些复杂,尤其是设置了旋转和俯视角度之后。不过我们可以从简单情况说起。
3D地图其实比2D多了一个环节,那就是墨卡托与3D世界坐标,3D世界与屏幕像素之间的转换。如果我们不想自找麻烦,通常3D坐标都是以米为单位,保持跟墨卡托的坐标单位一致,但是一般不直接以墨卡托的原点做3D世界的原点,因为墨卡托坐标比较大,后续计算精度是个问题。所以一般以用户设置的center转换成的墨卡托坐标为原点来建立3D的世界坐标系。
一般来讲大家使用的都是透视投影,由于3D世界在屏幕上的投影时非线性的,所以3D世界与屏幕像素之间的比值并不是固定的。但一般对地图来讲,不考旋转俯视情况下,相机的视线轴与水平面是垂直关系,那么就可以利用相机投影面高度与屏幕高的比值求出3D世界单位与像素的比值,这个分辨率我们成为resolution2
_getPixelMeterRatio(target) {
    target = target ? target : this.controls.target;
    let distance = this.camera.position.distanceTo(target);
    let top = this.camera instanceof PerspectiveCamera ?
      (Math.tan(this.camera.fov / 2 * DEG2RAD) * distance) :      this.camera.top / this.camera.zoom;
    let meterPerPixel = 2 * top / this.container.clientHeight;    return meterPerPixel;
  }
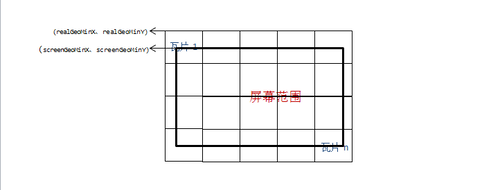
前面章节中我们有一个地图的瓦片像素分辨率resolution,只要让这两个分辨率的值相等,就能计算出相机应当距离水平面的合适高度,将css像素与瓦片像素一比一对应起来。但是这个时候不建议像2D那样用四个点的瓦片像素坐标来计算瓦片索引,建议将屏幕四个点转成3D坐标,3D坐标转成墨卡托,墨卡托转瓦片像素坐标,然后再求瓦片索引。为什么要多此一举,原因在于当俯视角度存在时,瓦片分辨率与resolution2并不相同,这时候的视野范围是个梯形,但是我们可以将屏幕坐标转成墨卡托坐标再来计算这个过程。
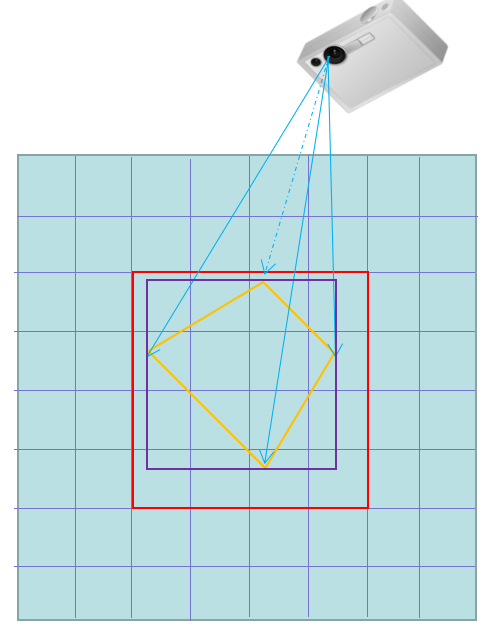
是的没错,那个梯形就是你的手机屏幕!至于这个梯形的计算过程,可以利用相机的fov、near、aspect等属性计算出四条射线,这四条射线与水平面的交点构成了一个梯形,这个梯形可以求出一个外包矩形,利用这个外包矩形求出瓦片的索引范围。像mapbox中计算的方法相对巧妙一些,没有直接通过相机坐标系求射线方式,而是利用屏幕坐标求出ndc坐标,通过将两个ndc坐标的z值分别设置为0和1求出一条射线,然后将ndc坐标转换成3d坐标,利用线性关系求出水平面的点(z=0)。从而求出那个梯形。
/**
     * Return all coordinates that could cover this transform for a covering
     * zoom level.
     * @param {Object} options
     * @param {number} options.tileSize
     * @param {number} options.minzoom
     * @param {number} options.maxzoom
     * @param {boolean} options.roundZoom
     * @param {boolean} options.reparseOverscaled
     * @param {boolean} options.renderWorldCopies
     * @returns {Array<Tile>} tiles     */
    coveringTiles(
        options: {
            tileSize: number,
            minzoom?: number,
            maxzoom?: number,
            roundZoom?: boolean,
            reparseOverscaled?: boolean,
            renderWorldCopies?: boolean
        }
    ) {
        let z = this.coveringZoomLevel(options);
        const actualZ = z;        if (options.minzoom !== undefined && z < options.minzoom) return [];        if (options.maxzoom !== undefined && z > options.maxzoom) z = options.maxzoom;

        const centerCoord = this.pointCoordinate(this.centerPoint, z);
        const centerPoint = new Point(centerCoord.column - 0.5, centerCoord.row - 0.5);// 利用屏幕四个点求ndc坐标,ndc坐标转3D坐标,根据线性关系求出交点
        const cornerCoords = [            this.pointCoordinate(new Point(0, 0), z),            this.pointCoordinate(new Point(this.width, 0), z),            this.pointCoordinate(new Point(this.width, this.height), z),            this.pointCoordinate(new Point(0, this.height), z)
        ];        return tileCover(z, cornerCoords, options.reparseOverscaled ? actualZ : z, this._renderWorldCopies)
            .sort((a, b) => centerPoint.dist(a.canonical) - centerPoint.dist(b.canonical));
    }
下面这个函数就是mapbox中求交点步骤的巧妙之处
pointCoordinate(p: Point, zoom?: number) {        if (zoom === undefined) zoom = this.tileZoom;

        const targetZ = 0;        // since we don't know the correct projected z value for the point,
        // unproject two points to get a line and then find the point on that
        // line with z=0
        const coord0 = [p.x, p.y, 0, 1];
        const coord1 = [p.x, p.y, 1, 1];

        vec4.transformMat4(coord0, coord0, this.pixelMatrixInverse);
        vec4.transformMat4(coord1, coord1, this.pixelMatrixInverse);

        const w0 = coord0[3];
        const w1 = coord1[3];
        const x0 = coord0[0] / w0;
        const x1 = coord1[0] / w1;
        const y0 = coord0[1] / w0;
        const y1 = coord1[1] / w1;
        const z0 = coord0[2] / w0;
        const z1 = coord1[2] / w1;

        const t = z0 === z1 ? 0 : (targetZ - z0) / (z1 - z0);        return new Coordinate(
            interp(x0, x1, t) / this.tileSize,
            interp(y0, y1, t) / this.tileSize,            this.zoom)._zoomTo(zoom);
    }
共同学习,写下你的评论
评论加载中...
作者其他优质文章