之前写过《使用SwingBench 对Oracle RAC DB性能 压力测试》,使用的是最基础直观的图形模式,已经可以满足大多数需求。
但是在有些场景下,图形模式可能本身消耗资源过大,尤其在生成大量测试数据时,很可能会由于图形本身的不稳定导致卡死甚至直接中途退出,严重影响效率和测试体验。
而如果采用静默模式,直接使用xml编辑又不能很好的确认改的是否正确。
本文主要介绍下我在做某次压力测试时发现的小技巧。
1.生成压测数据
之前使用图形界面时,我们直接去执行 ./oewizard 即可调用图形界面按照提示一步步配置最终生成压力测试的数据。
而使用字符模式,则需要指定参数配置文件以及一些必要的参数,先来看都有哪些参数:
[oracle@db50 bin]$ ./oewizard -h
usage: parameters:
 -allindexes             build all indexes for schema
 -bigfile                use big file tablespaces
 -c <filename>           wizard config file
 -cl                     run in character mode
 -compositepart          use a composite paritioning model if it exisits
 -compress               use default compression model if it exists
 -create                 create benchmarks schema
 -cs <connectString>     connectring for database
 -dba <username>         dba username for schema creation
 -dbap <password>        password for schema creation
 -debug                  turn on debugging output
 -debugf                 turn on debugging output to file (debug.log)
 -df <datafile>          datafile name used to create schema in
 -drop                   drop benchmarks schema
 -dt <driverType>        driver type (oci|thin)
 -g                      run in graphical mode (default)
 -generate               generate data for benchmark if available
 -h,--help               print this message
 -hashpart               use hash paritioning model if it exists
 -hcccompress            use HCC compression if it exisits
 -nocompress             don't use any database compression
 -noindexes              don't build any indexes for schema
 -nopart                 don't use any database partitioning
 -normalfile             use normal file tablespaces
 -oltpcompress           use OLTP compression if it exisits
 -p <password>           password for benchmark schema
 -part                   use default paritioning model if it exists
 -pkindexes              only create primary keys for schema
 -rangepart              use a range paritioning model if it exisits
 -s                      run in silent mode
 -scale <scale>          mulitiplier for default config
 -sp <soft partitions>   the number of softparitions used. Defaults to cpu
                         count
 -tc <thread count>      the number of threads(parallelism) used to
                         generate data. Defaults to cpus*2
 -ts <tablespace>        tablespace to create schema in
 -u <username>           username for benchmark schema
 -v                      run in verbose mode when running from command
                         line
 -version <version>      version of the benchmark to run
[oracle@db50 bin]$
实际我这里测试,用到的参数有 -cl, -create, -c, -scale, -tc, -part
其中-cl, -create是必须的;-c是指定某个xml配置文件,-scale是指纯数据量(是默认1G配置的多少倍),-tc是指并行度,-part是指分区。
./oewizard -cl -create -c oewizard.xml -scale 150 -tc 64 -part
而关于oewizard.xml 这个配置文件,我只改了下面这部分的内容,其他保持不变:
<DefaultParameters>
   <Parameter Key="datatablespacesexists" Value="true"/>
   <Parameter Key="password" Value="soe"/>
   <Parameter Key="username" Value="soe"/>
   <Parameter Key="datafile" Value="+DATA"/>
   <Parameter Key="userexists" Value="true"/>
   <Parameter Key="connectionstring" Value="//db50/jyzhao"/>
   <Parameter Key="connectiontype" Value="thin"/>
   <Parameter Key="onlydropuser" Value="false"/>
   <Parameter Key="operation" Value="create"/>
   <Parameter Key="tablespace" Value="SOE"/>
   <Parameter Key="dbausername" Value="sys as sysdba"/>
   <Parameter Key="dbapassword" Value="oracle"/>
   <Parameter Key="output" Value="Verbose"/></DefaultParameters>
主要就是确认压测用户及密码,以及数据文件的创建位置、数据库连接字符串、数据库sys用户及密码这些项。
而技巧就是,如果不确认自己的配置文件写的正确与否,可以先这样执行,带入对应的参数,调用图形走一遍check下所有配置:
./oewizard -c oewizard.xml -scale 150 -tc 64 -part
确认无误后,我这里由于生成的数据量很大,裸数据就150G,这还不算索引。所以采用后台执行的方式,并在执行前后记录一个时间:
--1.生成压测数据脚本
$ cat test150.sh
dateecho "=====Begin====="./oewizard -cl -create -c oewizard.xml -scale 150 -tc 64 -partecho "=====End====="date

--2.后台执行,输出日志
nohup sh test150.sh > test150.log &

--3.跟踪日志输出
tail -20f test150.log
最终花了将近4小时才生成完毕:
[oracle@yzdb1 bin]$ tail -20f test150.log
Fri Aug 31 10:52:54 CST 2018
=====Begin=====
SwingBench Wizard
Author  :        Dominic GilesVersion :        2.5.0.971Running in Lights Out Mode using config file : oewizard.xml============================================
|           Datagenerator Run Stats        |
============================================Connection Time                        0:00:00.005Data Generation Time                   3:41:44.395DDL Creation Time                      0:09:00.405Total Run Time                         3:50:44.809Rows Inserted per sec                      136,446Data Generated (MB) per sec                   10.9Actual Rows Generated                1,816,220,694Post Creation Validation Report
===============================
The schema appears to have been created successfully.

Valid Objects
=============
Valid Tables : 'ORDERS','ORDER_ITEMS','CUSTOMERS','WAREHOUSES','ORDERENTRY_METADATA','INVENTORIES','PRODUCT_INFORMATION','PRODUCT_DESCRIPTIONS','ADDRESSES','CARD_DETAILS'Valid Indexes : 'PRD_DESC_PK','PROD_NAME_IX','PRODUCT_INFORMATION_PK','PROD_SUPPLIER_IX','PROD_CATEGORY_IX','INVENTORY_PK','INV_PRODUCT_IX','INV_WAREHOUSE_IX','ORDER_PK','ORD_SALES_REP_IX','ORD_CUSTOMER_IX','ORD_ORDER_DATE_IX','ORD_WAREHOUSE_IX','ORDER_ITEMS_PK','ITEM_ORDER_IX','ITEM_PRODUCT_IX','WAREHOUSES_PK','WHS_LOCATION_IX','CUSTOMERS_PK','CUST_EMAIL_IX','CUST_ACCOUNT_MANAGER_IX','CUST_FUNC_LOWER_NAME_IX','ADDRESS_PK','ADDRESS_CUST_IX','CARD_DETAILS_PK','CARDDETAILS_CUST_IX'Valid Views : 'PRODUCTS','PRODUCT_PRICES'Valid Sequences : 'CUSTOMER_SEQ','ORDERS_SEQ','ADDRESS_SEQ','LOGON_SEQ','CARD_DETAILS_SEQ'Valid Code : 'ORDERENTRY'Schema Created
=====End=====
Fri Aug 31 14:43:42 CST 2018
事实证明我在执行开始和结束的地方加的这个时间,有些多此一举了哈,人家软件有统计Total Run Time。
2.进行压力测试
使用图形模式,就是直接执行 ./swingbench 然后配置完成后进行压力测试直接可以直观显示类似下面这样的压测结果: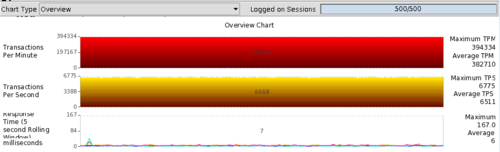
使用字符的话,就需要调用 ./charbench ,有效的参数如下:
[oracle@db50 bin]$ ./charbench -h
usage: parameters:
 -D <variable=value>           use value for given environment variable
 -a                            run automatically
 -be <stopafter>               end recording statistics after. Value is in
                               the form hh:mm
 -bg                           indicate that charbench will be run in the
                               background
 -bs <startafter>              start recording statistics after. Value is                               in the form hh:mm
 -c <filename>                 specify config file
 -co <hostname>                specify/override coordinator in
                               configuration file.
 -com <comment>                specify comment for this benchmark run (in
                               double quotes)
 -cpuloc <hostname >           specify/overide location/hostname of the
                               cpu monitor.
 -cpupass                      specify/overide os password of the user
                               used to monitor cpu.
 -cpuuser                      specify/overide os username of the user
                               used to monitor cpu.
 -cs <connectstring>           override connect string in configuration                               file
 -debug                        turn on debugging. Written to standard out
 -debugf                       turn on debugging. Witten to debug.log.
 -debugfine                    turn on finest level of debugging
 -di <shortname(s)>            disable transactions(s) by short name,
                               comma separated
 -dt <drivertype>              override driver type in configuration file
                               (thin, oci, ttdirect, ttclient)
 -dumptx                       output transaction response times to file
 -dumptxdir <directory name>   directory for transaction response times
                               files
 -en <shortname(s)>            enable transactions(s) by short name, comma
                               separated
 -env                          display environment configuration
 -f                            force data collection and run termination
                               regardless of state
 -g <groupID>                  distributed group identifier
 -h,--help                     print this message
 -i                            run interactively (default)
 -intermax <milliseconds>      override minimum inter transaction sleep
                               time (default = 0)
 -intermin <milliseconds>      override minimum inter transaction sleep
                               time (default = 0)
 -ld <milliseconds>            specify/overide the logon delay
                               (milliseconds)
 -max <milliseconds>           override maximum intra transaction think
                               time in configuration file
 -min <milliseconds>           override minimum intra transaction think
                               time in configuration file
 -p <password>                 override password in configuration file
 -r <filename>                 specify results file
 -rr                           specify/overide refresh rate for charts in
                               secs
 -rt <runtime>                 specify/overide run time for the benchmark.                               Value is in the form hh:mm
 -s                            run silent
 -stats <stats level>          specify level result stats detail (full or
                               simple)
 -u <username>                 override username in configuration file
 -uc <user count>              override user count in configuration file.
 -v <options>                  display run statistics (vmstat/sar like
                               output), options include (comma separated no spaces).
                               trans|cpu|disk|dml|errs|tpm|tps|users|resp|vresp
 -vo <verboseOutput>           output file for verbose output (defaults to
                               stdout)
[oracle@db50 bin]$
而最重要的xml配置文件如果手动编辑就更是很苦恼的一件事,同样利用技巧,图形调用后配置好各参数然后另存为导出一份xml配置即可。
比如导出的xml配置文件是模拟的2000并发的OLTP类型业务,文件名取为oltp2000.xml
那么字符测试就可以直接调用:
--简单的只看事物量
[oracle@db50 bin]$ ./charbench -c oltp2000.xml

--指定其中一台机器登陆信息,同时看到这台机器的CPU和I/O负载情况,以及响应时间
[oracle@db50 bin]$ ./charbench -c oltp2000.xml -cpuloc db50 -cpuuser oracle -cpupass oracle -v 'users,cpu,disk,tpm,tps,resp' > oltp2000_load50.log
[oracle@db50 bin]$ ./charbench -c oltp2000.xml -cpuloc db52 -cpuuser oracle -cpupass oracle -v 'users,cpu,disk,tpm,tps,resp' > oltp2000_load52.log

--准生产的数据当时没有留存,这里就用我实验环境的数据(50并发)简单说明下:
[oracle@db50 bin]$ tail -20f oltp2000_load50.log
Author  :        Dominic GilesVersion :        2.5.0.971Results will be written to results.xml.Hit Return to Terminate Run...Time            Users   User    System  Wait    Idle    Bi      Bo      TPM     TPS     Response23:19:30        [0/50]  0       0       0       0       0       0       0       0       023:19:33        [0/50]  0       0       0       0       0       0       0       0       023:19:34        [0/50]  11      22      2       65      19      2194    0       0       023:19:35        [0/50]  27      44      0       28      155     1514    0       0       023:19:36        [0/50]  8       24      1       67      31      1593    0       0       023:19:37        [12/50] 5       27      2       65      56      2626    0       0       023:19:38        [35/50] 6       11      1       82      39      1152    0       0       023:19:39        [50/50] 8       20      2       71      23      2802    0       0       023:19:40        [50/50] 16      33      0       51      820     1218    43      43      23323:19:41        [50/50] 26      73      1       0       1780    580     161     118     39023:19:42        [50/50] 45      54      1       0       1833    658     264     103     39323:19:43        [50/50] 36      63      1       0       1959    655     384     120     36123:19:44        [50/50] 25      75      0       0       1999    703     487     103     36623:19:45        [50/50] 33      66      1       0       1611    588     563     76      38023:19:46        [50/50] 46      53      1       0       1727    724     650     87      38423:19:47        [50/50] 35      64      1       0       1607    694     766     116     37623:19:48        [50/50] 30      69      1       0       1587    596     852     86      38223:19:49        [50/50] 31      68      1       0       2227    629     945     93      38023:19:50        [50/50] 46      54      0       0       2611    689     1034    89      38523:19:51        [50/50] 35      64      1       0       1763    626     1127    93      38523:19:52        [50/50] 22      76      2       0       2276    825     1248    121     37923:19:53        [50/50] 29      70      1       0       2195    787     1378    130     37123:19:54        [50/50] 43      55      2       0       2075    767     1490    112     36523:19:55        [50/50] 39      61      0       0       1827    965     1617    127     35923:19:56        [50/50] 29      71      0       0       1951    646     1715    98      36023:19:57        [50/50] 37      63      0       0       1611    946     1799    84      36523:19:58        [50/50] 45      55      0       0       1671    834     1912    113     36623:19:59        [50/50] 34      66      0       0       1867    705     2023    111     36223:20:00        [50/50] 39      61      0       0       2235    889     2137    114     35823:20:01        [50/50] 40      60      0       0       1931    859     2245    108     35723:20:02        [50/50] 36      64      0       0       1866    892     2362    117     35523:20:03        [50/50] 38      62      0       0       2758    734     2450    88      35323:20:04        [50/50] 42      58      0       0       3191    913     2539    89      35123:20:05        [50/50] 47      53      0       0       2451    935     2636    97      35223:20:06        [50/50] 48      52      0       0       2059    652     2725    89      35023:20:07        [50/50] 42      58      0       0       2575    995     2802    77      34823:20:08        [50/50] 42      58      0       0       2295    658     2868    66      355
可以看到,我这里测试的50个用户[50/50]很快连接上,之后CPU的信息有4列(User, System, Wait, Idle),I/O的信息(Bi, Bo)有两列,最后三列(TPM, TPS, Response)就分别是每分钟事物量、每秒种事物量、响应时间。
当然了我这里的这个测试环境由于配置很低,且没有做专门的调优,测出的性能数据不是很好看了,只是演示用~
原文出处:https://www.cnblogs.com/jyzhao/p/9568806.html
共同学习,写下你的评论
评论加载中...
作者其他优质文章