
echarts同一页面四个图表切换的js数据交互
标签:
JavaScript
需求:点击tab页,切换四个不同的图表,ajax向后台请求数据,展示在四个不同的图表中。
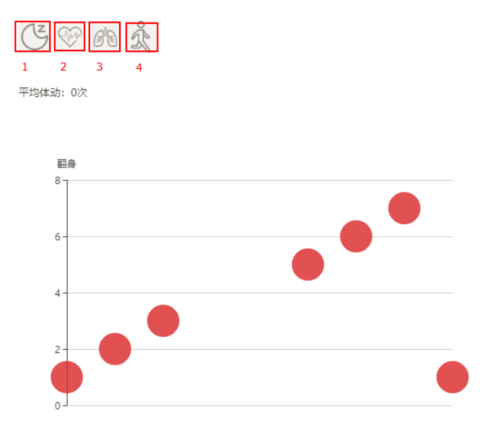
图片.png
其余的就不多说,直接上js代码了
$(function() {
    $("#heart").on("click", function() {

        $('.heart-car').show();
        $('.sleep-car').hide();
        $('.breathe-car').hide();
        $('.sport-car').hide();

    });

    $("#breathe").on("click", function() {

        $('.heart-car').hide();
        $('.sleep-car').hide();
        $('.breathe-car').show();
        $('.sport-car').hide();
    });
    $("#sport").on("click", function() {

        $('.heart-car').hide();
        $('.sleep-car').hide();
        $('.breathe-car').hide();
        $('.sport-car').show();

    });
    $("#sleep").on("click", function() {

        $('.heart-car').hide();
        $('.sleep-car').show();
        $('.breathe-car').hide();
        $('.sport-car').hide();

    });


    /* 第一个图表 */

    var aChart = echarts.init(document.getElementById("main"));    function aFun(x_data, y_data) {
        aChart.setOption({            title: {                text: '睡眠质量监测'
            },            tooltip: {                trigger: 'axis'
            },            xAxis: {                data: x_data
            },            yAxis: {                splitLine: {                    show: false
                }
            },            toolbox: {                left: 'center',                feature: {                    dataZoom: {                        yAxisIndex: 'none'
                    },                    restore: {},                    saveAsImage: {}
                }
            },            dataZoom: [{                startValue: '2014-06-01'
            }, {                type: 'inside'
            }],            visualMap: {                top: 10,                right: 10,                pieces: [ {                    gt: 0,                    lte: 1,                    color: '#ffde33'
                }, {                    gt: 1,                    lte: 2,                    color: '#ff9933'
                }, {                    gt: 2,                    lte: 3,                    color: '#cc0033'
                }, {                    gt: 3,                    lte: 4,                    color: '#660099'
                }],                outOfRange: {                    color: '#999'
                }
            },            series: {                name: '睡眠',                type: 'line',                data: y_data,                markLine: {                    silent: true,                    data: [{                        yAxis: 0
                    }, {                        yAxis: 1
                    }, {                        yAxis: 2
                    }, {                        yAxis: 3
                    }, {                        yAxis: 4
                    }]
                }
            }
        });
    }    /* 第二个图表 */
    // 折线图
    var bChart = echarts.init(document.getElementById("main2"));    function bFun(x_data, y_data) {
        bChart.setOption({            color : [ '#3398DB' ],            tooltip : {                trigger : 'axis',                axisPointer : { // 坐标轴指示器,坐标轴触发有效
                    type : 'shadow' // 默认为直线,可选为:'line' | 'shadow'
                }
            },            legend : {                data : [ '心率值' ]
            },            grid : {                left : '3%',                right : '20%',                bottom : '20%',                containLabel : true
            },            xAxis : [ {                type : 'category',                data : x_data,
            } ],            yAxis : [ { // 纵轴标尺固定
                type : 'value',                scale : true,                name : '心率值',                max : 140,                min : 0,                splitNumber : 20,                boundaryGap : [ 0.2, 0.2 ]
            } ],            series : [ {                name : '心率',                type : 'line',                data : y_data
            } ]
        }, true);
    }    /* 第三个图表 */
    // 折线图
    var cChart = echarts.init(document.getElementById("main3"));    function cFun(x_data, y_data) {
        cChart.setOption({            color : [ '#3398DB' ],            tooltip : {                trigger : 'axis',                axisPointer : { // 坐标轴指示器,坐标轴触发有效
                    type : 'shadow' // 默认为直线,可选为:'line' | 'shadow'
                }
            },            legend : {                data : [ '呼吸值' ]
            },            grid : {                left : '3%',                right : '20%',                bottom : '20%',                containLabel : true
            },            xAxis : [ {                type : 'category',                data : x_data,
            } ],            yAxis : [ { // 纵轴标尺固定
                type : 'value',                scale : true,                name : '呼吸值',                max : 50,                min : 0,                splitNumber : 20,                boundaryGap : [ 0.2, 0.2 ]
            } ],            series : [ {                name : '呼吸',                type : 'line',                data : y_data
            } ]
        }, true);
    }


    /* 第四个图表 */
    // 基于准备好的dom,初始化echarts实例
    var dChart = echarts.init(document.getElementById('main4'));    // 指定图表的配置项和数据
    function dFun(data) {
        dChart.setOption({
             tooltip: {
                    /*返回需要的信息*/
                    formatter: function(param) {
                        var value = param.value;
                        return '<div style="border-bottom: 1px solid rgba(255,255,255,.3); font-size: 16px;padding-bottom: 7px;margin-bottom: 7px;"> ' + value[0] + " 翻身"
                            '</div>';
                    }
                },
                xAxis: {                    show : false,                    type: 'time',                    name: '时间轴',


                },                yAxis: {                    type: 'value',                    name: '翻身',                    max: 9,                    min: 0,
                },                series: [{                    name: '',                    data: data,                    type: 'scatter',                    symbolSize: 40
                }]
            });
    }


    $.ajax({        url : "/bison/stats/mattess/getDetail?id=" + $("#sid").val(),        async : false,        type : 'GET',        dataType : 'json',        success : function(data) {
            var status = data.returnData.status;
            status.echatX == ''?aFun("[]","[]"):aFun(status.echatX,status.echatY);
            var hb = data.returnData.heartBreath;            if(hb.echatX == ''){
                bFun("[]","[]");
                cFun("[]","[]");
            }else{
                bFun(hb.echatX, hb.echatY);
                cFun(hb.echatX, hb.echatY2);
            }
            var move = data.returnData.move;
            dFun(move);

        },
    });

})
作者:祈澈菇凉
链接:https://www.jianshu.com/p/8ba963da64d0
点击查看更多内容
为 TA 点赞
评论
共同学习,写下你的评论
评论加载中...
作者其他优质文章
正在加载中


感谢您的支持,我会继续努力的~
扫码打赏,你说多少就多少
赞赏金额会直接到老师账户
支付方式
打开微信扫一扫,即可进行扫码打赏哦