

-
// svg
const SVG_WIDTH = 500
const SVG_HEIGHT = 250
const SVG_MARGIN = { left: 50, top: 30, right: 20, bottom: 20 }
const G_WIDTH = SVG_WIDTH - SVG_MARGIN.left - SVG_MARGIN.right
const G_HEIGHT = SVG_HEIGHT - SVG_MARGIN.top - SVG_MARGIN.bottom
// d3.select('#container').append('svg:svg')
const svg = d3
.select('#container')
.append('svg')
//width height
.attr('width', SVG_WIDTH) // attribute
.attr('height', SVG_HEIGHT)
const g = d3
.select('svg')
.append('g')
.attr('transform', `translate(${SVG_MARGIN.left}, ${SVG_MARGIN.top})`)
const data = [1, 3, 5, 7, 8, 4, 3, 7]
const scaleX = d3
.scaleLinear()
.domain([0, data.length]) // 输入的范围
.range([0, G_WIDTH]) // 输出的范围
const scaleY = d3
.scaleLinear()
.domain([0, d3.max(data)]) // 输入的范围
.range([G_HEIGHT, 0]) // 输出的范围
// const lineGenerartor = d3.svg
const lineGenerartor = d3
.line()
// .x((d, i) => i) // 0,1,2,3,4
.x((d, i) => scaleX(i)) // 0,1,2,3,4
.y((d) => scaleY(d)) // 1, 3, 5, 7, 8, 4, 3, 7
// .interpolate('cardinal') // 线的拟合方式
.curve(d3.curveCatmullRom.alpha(0.5)) // 线的拟合方式
g.append('path').attr('d', lineGenerartor(data)) //d=M1,0L20,$0L40,50L!00,200L0,200 d : is a short for path data
const xAxis = d3.axisBottom(scaleX)
const yAxis = d3.axisLeft(scaleY)
g.append('g').call(xAxis).attr('transform', `translate(0, ${G_HEIGHT})`)
g.append('g').call(yAxis)
查看全部 -
简单可视化查看全部
-
enter查看全部
-
https://blog.csdn.net/ysj1218/article/details/80523474,链式调用有点类似于jQuery
查看全部 -
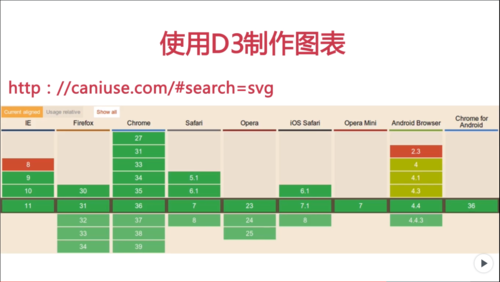
查看浏览器的支持列表
支持svg的浏览器,对d3的支持还是比较好的
查看全部 -
d3代码在github上
 查看全部
查看全部 -
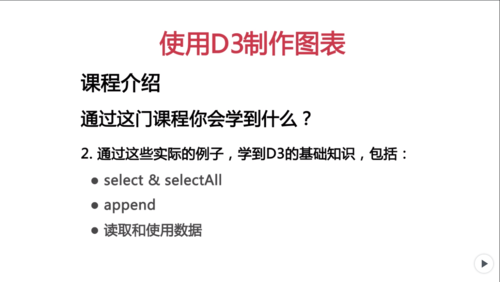
select&selectAll 选择html上的dom元素
append 添加我们想要的一些元素
读取和使用数据 使用一些函数来读取和使用数据,也可以使用dsv、csv一些数据格式
 查看全部
查看全部 -
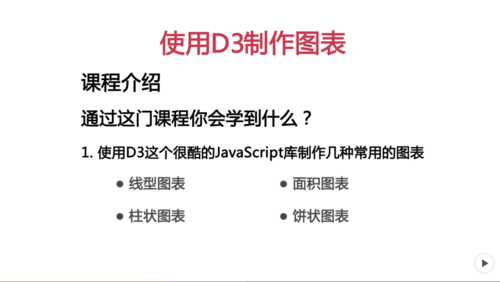 可以做什么查看全部
 -
g元素 相当于html中的div,可以理解为group查看全部
-
d3.select(selector) 选择符合条件的第一个元素 d3.selectAll(selector)选择符合条件的所有元素查看全部
-
v4用新的曲线API来说明如何根据数据为line和area插值。line.interpolate和area.interpolate方法由line.curve和area.curve代替。 1, curveCatmullRom 2, curveCatmullRomClosed 3, curveCatmullRomOpen this._d3.line().curve(this._d3.curveCatmullRom.alpha(.5));查看全部
-
V4 nterpolate("cardinal") -> curve(d3.curveCardinal); d3.svg.line() -> d3.line() d3.scale.linear() -> d3.scaleLinear()查看全部
-
bost.ocks.org/mike/circles/查看全部


举报