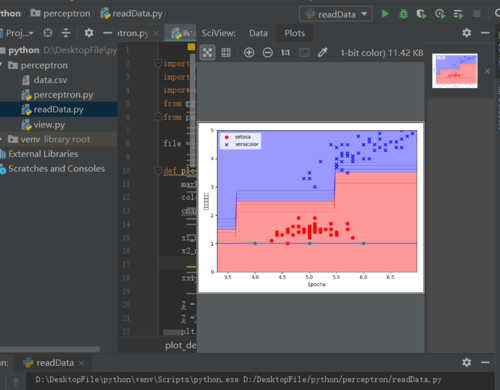
我的图像绘制不对劲,求老师和大佬帮忙
import pandas as pd
import matplotlib.pyplot as plt
import numpy as np
from matplotlib.colors import ListedColormap
from perceptron import perceptron

file ="data.csv"

def plot_decision_reqions(X,y,classifier,resolution=0.02):
    markers=('s','x','o','v')
    colors = ('red','blue','lightgreen','gray','cyan')
    cmap = ListedColormap(colors[:len(np.unique(y))])

    x1_min,x1_max = X[:,0].min() - 1,X[:,0].max()
    x2_min,x2_max = X[:,1].min() - 1 ,X[:,1].max()

    xx1,xx2 = np.meshgrid(np.arange(x1_min,x1_max,resolution),np.arange(x2_min,x2_max))

    Z = classifier.predict(np.array([xx1.ravel(),xx2.ravel()]).T)
    Z =Z.reshape(xx1.shape)
    plt.contourf(xx1,xx2,Z,alpha=0.4,cmap=cmap)
    plt.xlim(xx1.min(),xx1.max())
    plt.ylim(xx2.min(),xx2.max())

    for idx,cl in enumerate(np.unique(y)):
        plt.scatter(x=X[y==cl,0],y=X[y==cl,1],alpha=0.8,c=cmap(idx),marker=markers[idx],label=cl)


df = pd.read_csv(file,header=None)
y = df.loc[0:99,4].values
y = np.where(y=='Iris-setosa',-1,1)
X =df.iloc[0:100,[0,2]].values

plt.scatter(X[:50,0],X[:50,1],color='red',marker='o',label='setosa')
plt.scatter(X[50:100,0],X[50:100,1],color='blue',marker='x',label='versicolor')
plt.xlabel('X')
plt.ylabel('Y')
plt.legend(loc='upper left')

ppn = perceptron(eta=0.1,n_iter=10)
ppn.fit(X,y)
plt.plot(range(1,len(ppn.errors_)+1),ppn.errors_,marker='o')
plt.xlabel('Epocha')
plt.ylabel('按错误次数分')
plot_decision_reqions(X,y,ppn,resolution=0.02)
plt.show()
画出的图像是这样的: