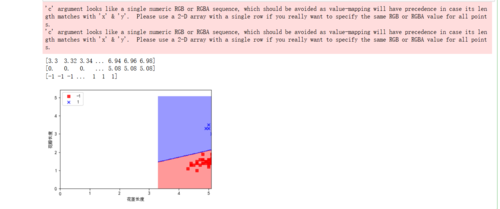
报错'c' argument looks like a single numeric RGB or RGBA sequence, which should be avoided as value-mapping will have precedence in case its length matches with 'x' & 'y'. Please use a 2-D array with a single row if you really want to specify the same RGB
哪位大佬救救我??
from matplotlib.colors import ListedColormap

def plot_decision_region(X, y, classifier, resolution=0.02):
    markers = ('s', 'x', 'o', 'v')
    colors = ('red', 'blue', 'lightgreen', 'gray', 'cyan')
    # len(np.unique(y))=2
    cmap = ListedColormap(colors[:len(np.unique(y))])
    # 花茎的长度
    x1_min, x1_max = X[:, 0].min() - 1, X[:, 0].max()
    # 花瓣的长度
    x2_min, x2_max = X[:, 1].min() - 1, X[:, 1].max()

    xx1, xx2 = np.meshgrid(np.arange(x1_min, x1_max, resolution), np.arange(x2_min, x2_max, resolution))
    z = classifier.predict(np.array([xx1.ravel(),xx2.ravel()]).T)
    print(xx1.ravel())
    print(xx2.ravel())
    print(z)

    z = z.reshape(xx1.shape)
    plt.contourf(xx1, xx2, z, alpha=0.4, cmap=cmap)
    plt.xlim(xx1.min(), xx1.max())
    plt.xlim(xx2.min(), xx2.max())

    for idx, cl in enumerate(np.unique(y)):
        plt.scatter(x=X[y==cl, 0], y=X[y==cl, 1], alpha=0.8, c=cmap(idx), marker=markers[idx], label=cl)
# 执行语句
plot_decision_region(X, y, ppn, resolution=0.02)
plt.rcParams['font.sans-serif'] = ['SimHei']
plt.xlabel('花茎长度')
plt.ylabel('花瓣长度')
plt.legend(loc='upper left')
plt.show()
import matplotlib.pyplot as plt import numpy as np # 1)得到数据前一百行的第五列 y = df.iloc[0:100, 4].values # 2)将字符串转化为数字-1和1 y = np.where(y == 'Iris-setosa', -1, 1) # 抽取前100条数据的第0列和第2列 X = df.iloc[0:100, [0, 2]].values
