您可以在plotly 文档中找到一堆 Dash 示例,大多数示例都以有关如何使用 Dash 构建图形的注释结尾:达世币呢?Dash 是一个用于构建分析应用程序的开源框架,不需要 JavaScript,并且与 Plotly 图形库紧密集成。但我想在 JupyterLab 中启动它们。那么我必须在以下“正常”Dash 应用程序中进行哪些更改才能使其在 JupyterLab 中运行?代码示例:import plotly.graph_objects as goimport plotly.express as pximport dashimport dash_core_components as dccimport dash_html_components as html# data and plotly figuredf = px.data.gapminder().query("country=='Canada'")fig = px.line(df, x="year", y="lifeExp", title='Life expectancy in Canada')# Set up Dash appapp = dash.Dash()app.layout = html.Div([ dcc.Graph(figure=fig)])# Launch Dash appapp.run_server(debug=True, use_reloader=False # Turn off reloader if inside Jupyter )
1 回答
神不在的星期二
TA贡献1963条经验 获得超6个赞
任何可用的 Dash 应用程序都可以通过JupyterLab启动,并使用问题中描述的设置,方法是use_reloader=False在以下位置指定:
app.run_server(debug=True,
use_reloader=False # Turn off reloader if inside Jupyter
)
但如果您想使用 JupyterLab 并launching the app in your default browser, inline in a cell or directly in Jupyter在其自己的选项卡中进行选择,只需按照以下简单步骤操作:
更改以下行
# 1
import dash
# 2
app = dash.Dash()
# 3
app.run_server(debug=True,
use_reloader=False # Turn off reloader if inside Jupyter
)
对此:
# 1
from jupyter_dash import JupyterDash
# 2
app = JupyterDash(__name__)
# 3
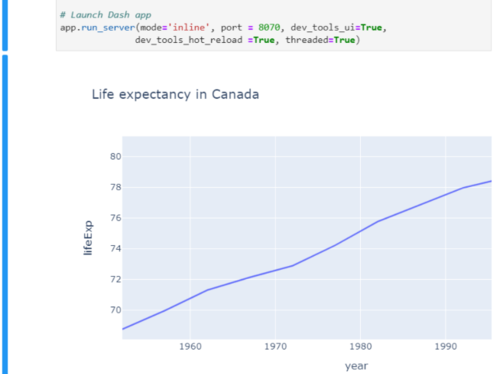
app.run_server(mode='inline', port = 8070, dev_tools_ui=True,
dev_tools_hot_reload =True, threaded=True)
这将直接在 JupyterLab 中内联启动 Dash :
但您也可以mode='external'启动 Dash 它自己的选项卡:

您可以设置mode='external'在默认浏览器中启动它。
经过更改的完整代码:'
import plotly.graph_objects as go
import plotly.express as px
# import dash
from jupyter_dash import JupyterDash
import dash_core_components as dcc
import dash_html_components as html
# data and plotly figure
df = px.data.gapminder().query("country=='Canada'")
fig = px.line(df, x="year", y="lifeExp", title='Life expectancy in Canada')
# Set up Dash app
# app = dash.Dash()
app = JupyterDash(__name__)
app.layout = html.Div([
dcc.Graph(figure=fig)
])
# Launch Dash app
# app.run_server(debug=True,
# use_reloader=False # Turn off reloader if inside Jupyter
# )
app.run_server(mode='inline', port = 8070, dev_tools_ui=True,
dev_tools_hot_reload =True, threaded=True)
添加回答
举报
0/150
提交
取消